A Day with the Faithful or “What would Euclid Do?”

Disclaimer alert: This post is more philosophical than procedural – your mileage may vary on what you get from reading this…it is more of an intellectual exploration for me…

I want to thank my son, Aukai, for letting me to reflect and talk to him about this issue to help me consider how I might write this post – he was a wonderful reflective partner and I am his debt for his time, interest and feedback. He is currently a Junior at Mid-Pacific Institute.

I spent the day on Saturday, March 1 The Hawaii Council of Math teachers annual conference (http://www.math.hawaii.edu/~tom/hctm/Speakers2014.pdf) with a few specific goals:
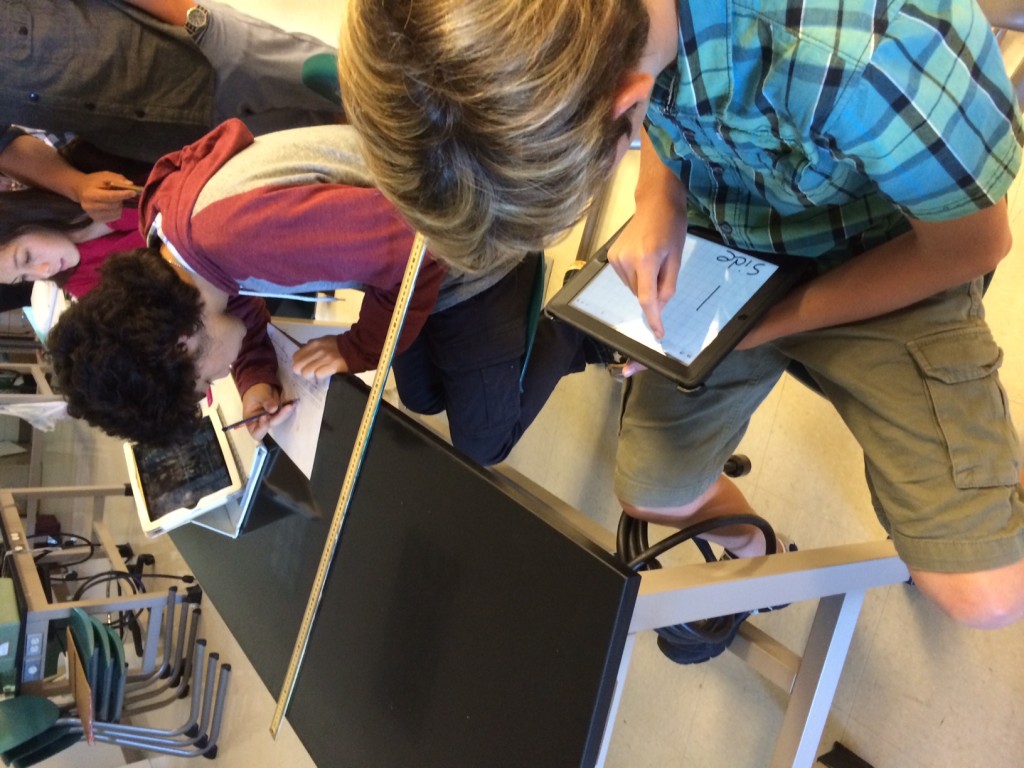
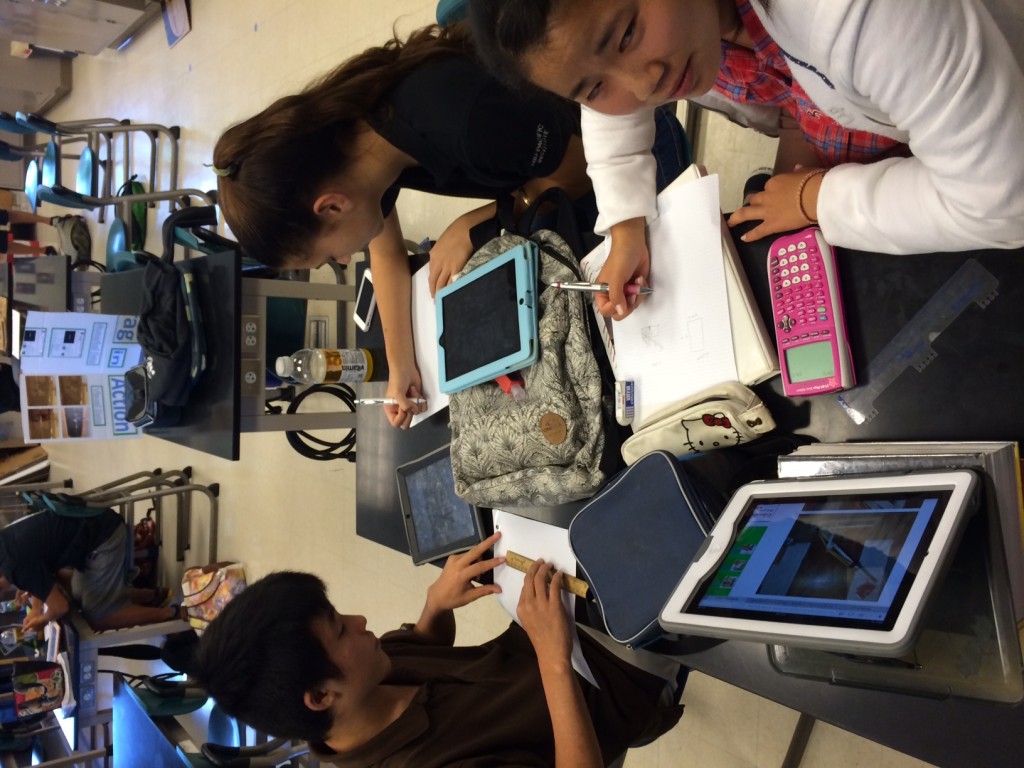
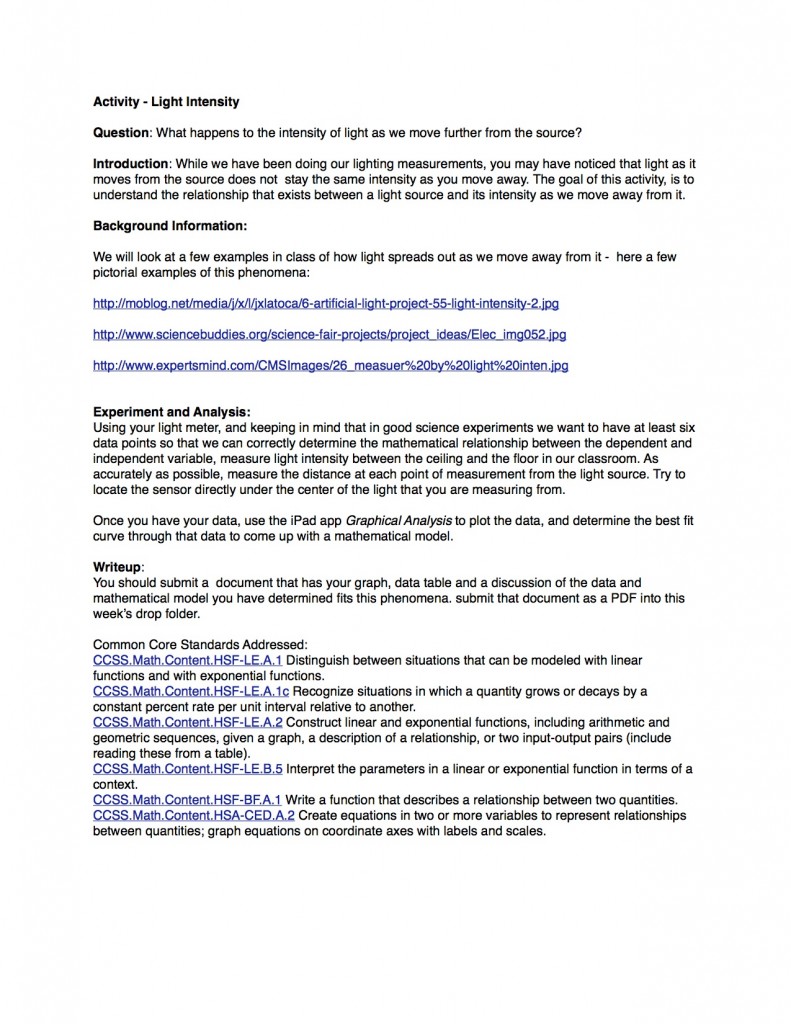
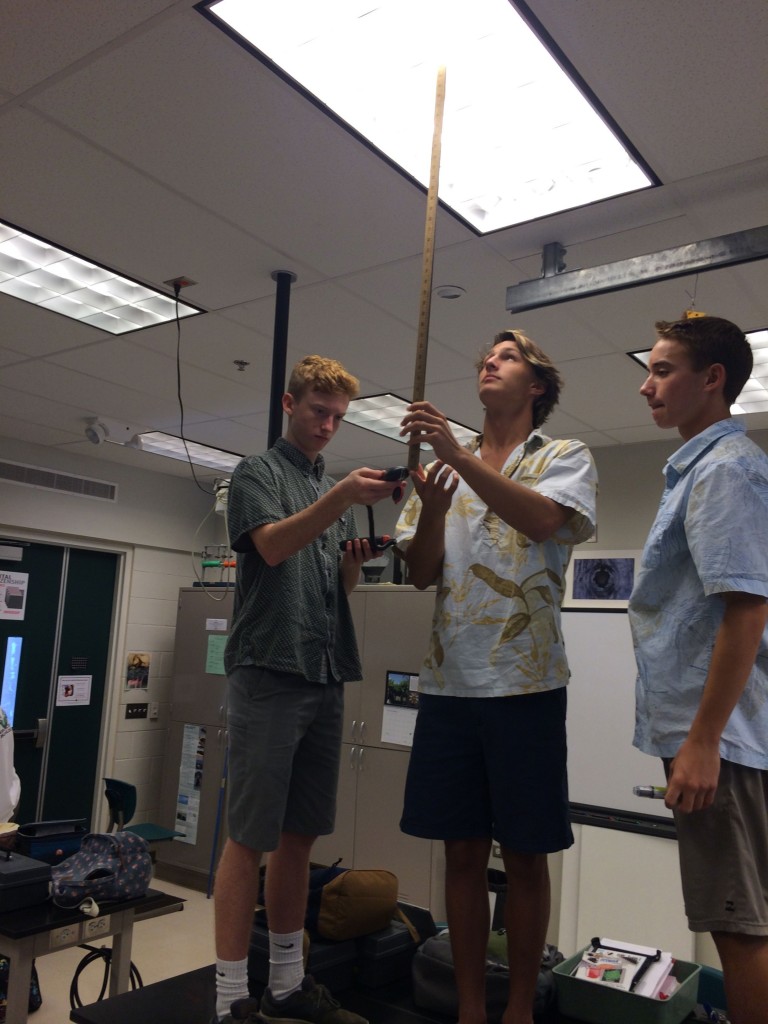
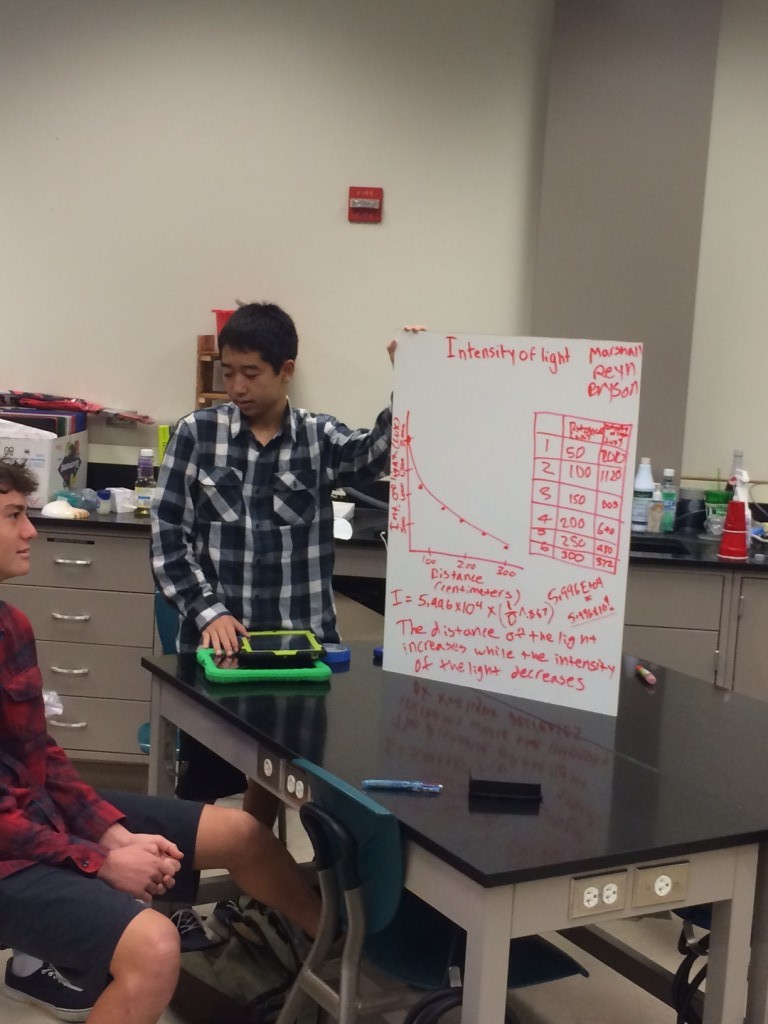
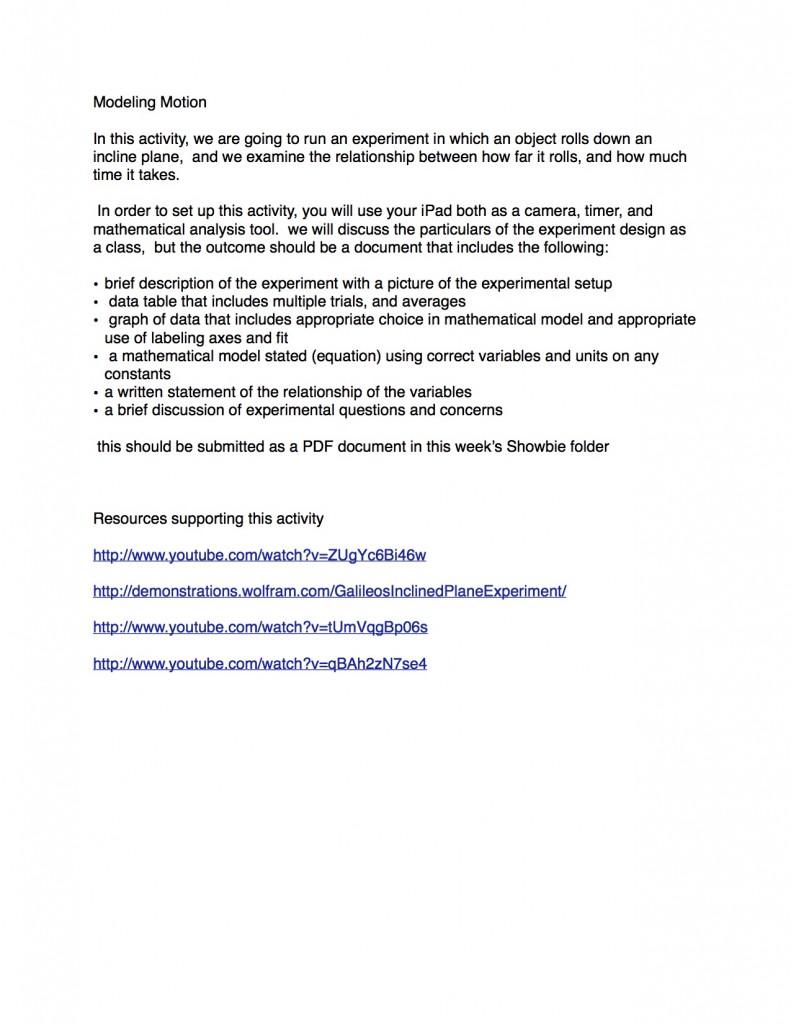
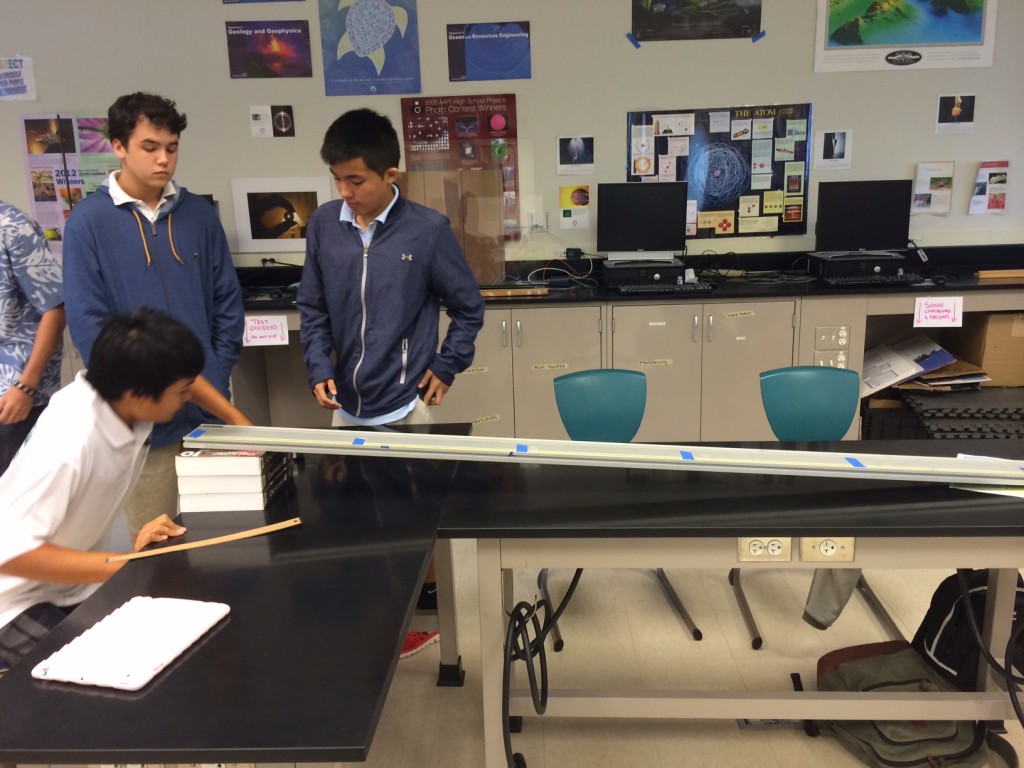
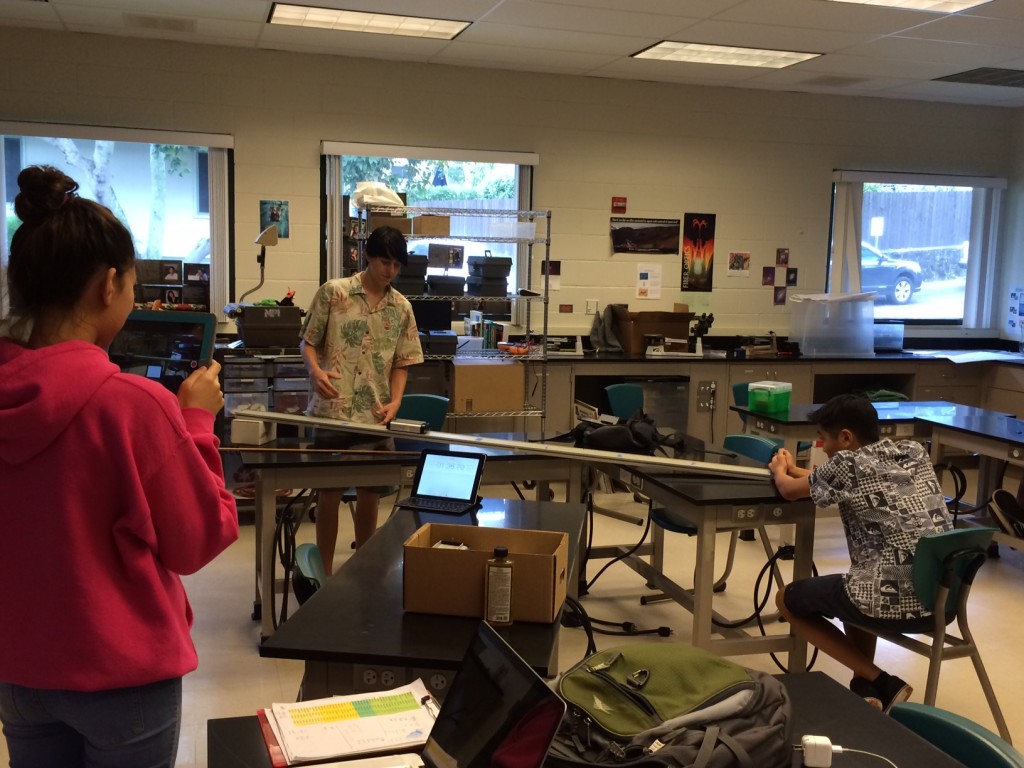
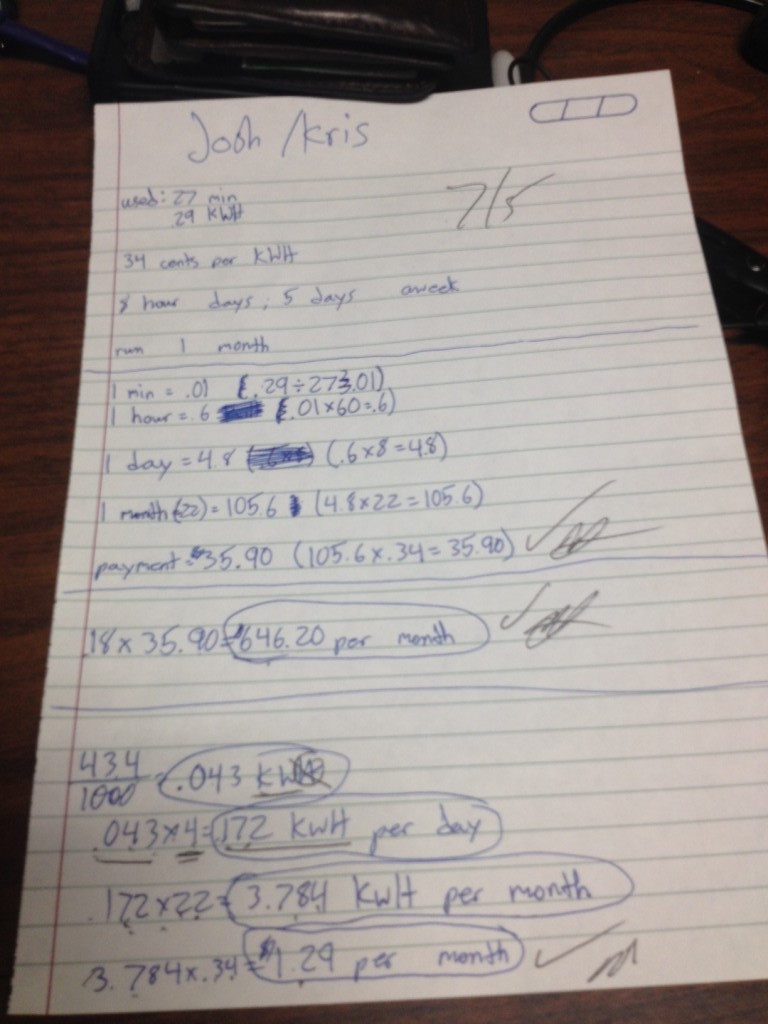
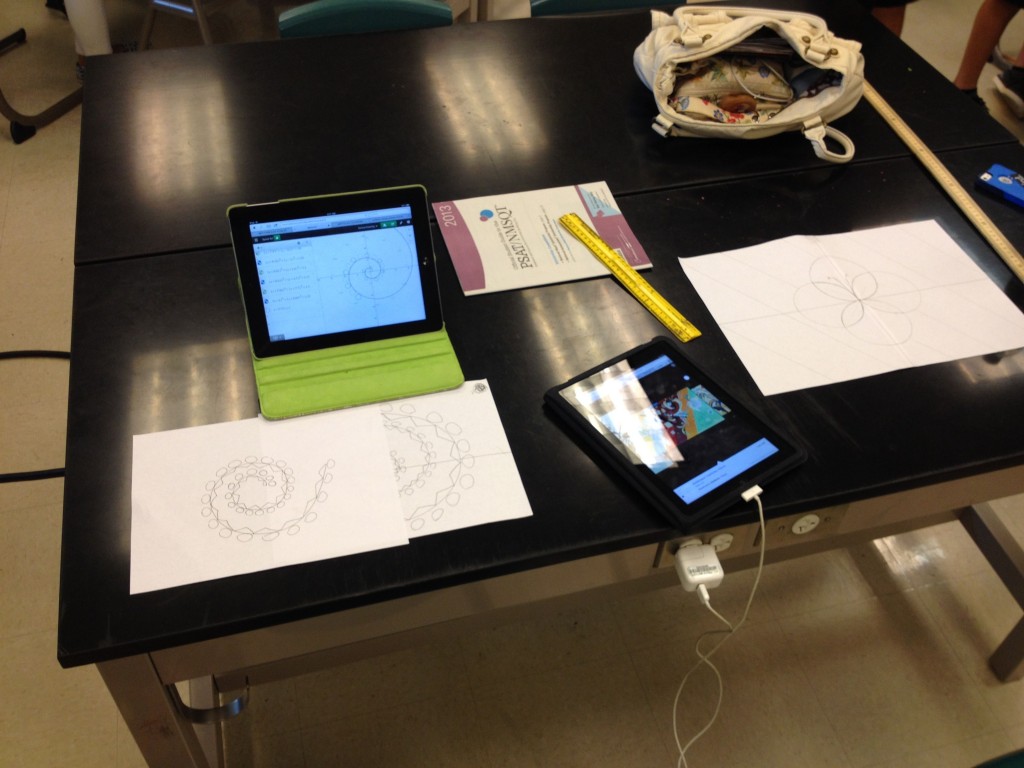
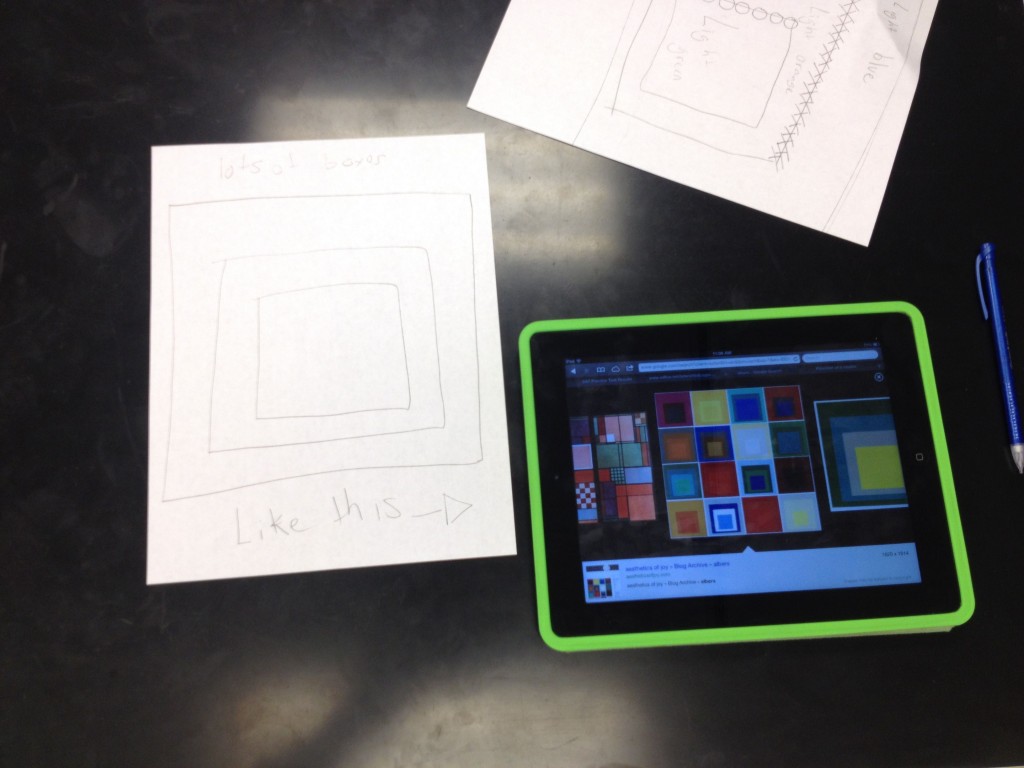
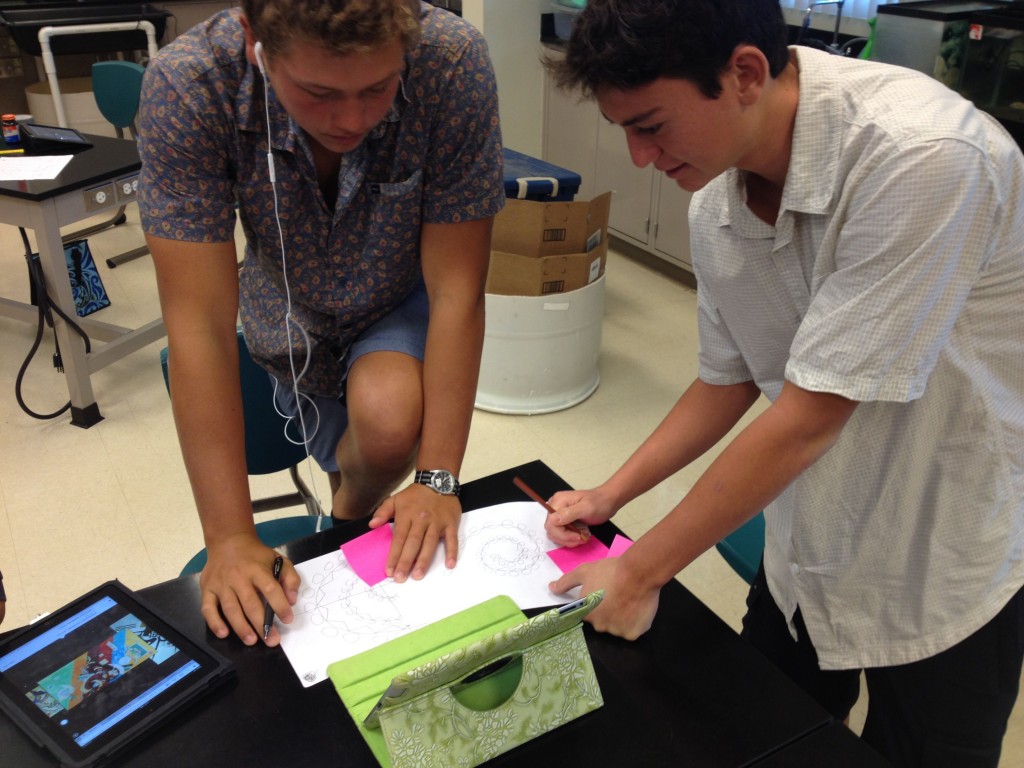
I gave a presentation that was titled “Hands-on, Minds-on Math – An Offering of Homegrown Math Projects and Activities“ – I was both excited and anxious about sharing the work I’ve been doing the past couple of years with my colleague Gregg on designing large and small projects and activities that incorporate mathematical thinking and concepts to real problems.
I was interested in attending other sessions to see what kinds of ways I might build my professional knowledge as a mathematics teacher
I was interested in getting connected to a network of math teachers to better my collegial connections with both our math department ( five other high school math teachers attended) as well other math teachers from the state and beyond.

As I was debriefing the experience of the day which was both rewarding and challenging, I was struck by the enthusiasm, the fervor – that our community exhibited. It’s probably no surprise to anyone that reads my blog or knows me, that I find myself particularly challenged with the more traditional ways that math is taught and learned, and how that fits into a larger picture of the ways in which we would like to see our students use math to further themselves and use it in their daily lives. In many ways, it struck me that this math meeting was like a church revival – true believers who enjoy the company of each other to reinforce and engage themselves in conversation about their excitement and belief in their faith as well as ways to improve the way they share it with their community. In a sense, the ending of the conference felt like a benediction – go forth and do good work and keep the faith. Go forth to engender in your students a knowledge of and passion of mathematically thinking.

But here is where I have a quandary. Since anyone that knows me knows that I teach math and science, I am often greeted with an apologies from people saying something like “I’m not very good at math” or “I really didn’t like math in school” much the same as someone who hasn’t been attending church might apologize to a religious friend saying I haven’t really followed through on my faith. I may be a blasphemer in saying this, but I don’t think that morality comes from just attending church or being part of a organized religion anymore that I think mathematical thinking comes solely from the traditional scope, sequence and pedagogy of math problems and content. I was raised Catholic, and if you didn’t go to confession, you felt guilty because you didn’t own up to God about your sins. In much the same way, if you did not do well in math there is a stigma of not being a mathematician, or somehow being viewed as religiously or mathematically unworthy.

( sidebar of a funny story that is relevant – was at a conference a few years ago when a mathematician about this issue shared a story of talking to a friend who was saying that they had taken German three times and failed. The person said dejectedly “there is no way that my brain could ever learn the German language”. Their friend responded “ it’s a good thing you weren’t born in Germany, then!”. Language skills and mathematical reasoning are much the same – if they are part of our culture and we are immersed in them fully, everyone can learn it. Perhaps not all equally, but certainly functionally.)

I fundamentally believe that part of being human is a brain that is mathematical. When a quarterback looks down the field to find an open receiver, they do some incredible mathematics – gauge the speed of their receiver, extrapolate what location they will be at at the right time, determine the space between that person and a defender, throw a ball with the correct arch and speed to put it in their hands accurately – and all of this done in the blink of an eye – if you had to program that mathematically, it would be incredibly complex – but isn’t that the point? They’re doing this mathematics instinctively but somehow it’s not considered ‘real’ math. After all, who says, “Tom Brady is a incredible mathematician!”

I am not trying to make the case that we should not be including mathematics education for all students in school. What I am wondering, is what that scope, sequence, pedagogy and assessment should be like and how white might at least be more inclusive to the different ways that math thinking can be both exhibited and build on success for students.

At a wonderful session I attended by Robert Kaplinsky http://robertkaplinsky.com/ he highlighted some the important ideas that come from the common core about mathematics education. The first was that proper mathematics education needs to stand on three legs equally:
* students must be fluent in operational procedures,
* students must demonstrate understanding of mathematical concepts and what they mean, and
* students must be able to apply mathematical concepts to new situations so that they can demonstrate true fluency with it.

Think of it this way: we wouldn’t teach a world language class and only test vocabulary and sentence structure – we want students to be able to explain the language, perhaps even asking them to compare and contrast the similarities to other languages. And we would want students to be able to apply the language – have a conversation, visit a country that uses that language predominantly and feel comfortable in it, be able to read and that language for meaning and pleasure.

A math teacher I knew a few years ago was talking to some higher level math students and he admitted to the students that most of mathematics education is designed to teach students to be calculators – to memorize and execute specific mathematical operations to solve specific problems. He admitted that the goal was not to make them mathematicians. The students were offended and asked why wouldn’t we design curriculum to help them be better mathematicians, and not just computers, and his response was “because you can’t handle it”. I fundamentally believe that no more than we would teach a musical instrument by having students in isolation learn scales and note positions, but never perform, or learn the rules of grammar and vocabulary and never write beyond simple prompts, we need to rethink math curriculum so that it gives students not just a chance to understand the operations and procedures that are so important, but also to put their knowledge into practice – to walk the walk, and talk the talk of true mathematicians.

I fundamentally believe all students can create art, can writes elegant creative essays, can find wonder and discover important ideas about our physical universe and can see the world as a mathematician. Perhaps they can’t do this all equally – not everyone gets to be or wants to be the quarterback. But the idea of creating mathematicians in skill, understanding, and application challenges me to keep working on the curriculum I design and the experiences that my students have in my class.

Still left unanswered in this post, is a conversation about standardized tests like the SAT. Another day…

The slides from my presentation on some of the ways I’ve tried to design relevant, rigorous and engaging curricula are in my blog post previous to this is a PDF.

Religion and faith and mathematics are a tricky business – we want everyone to appreciate, embrace and apply the wonders we see unfolded from our higher view. The real challenge is to find ways to make that happen in the lives of everyone, regardless of their leanings, capabilities and dispositions.

This post is already gotten long, and I could rant on some more, but it was the beginning of my unpacking of my thinking from the conference…my work and thinking is “To Be Continued…”

When you don’t know where you are going, any road will do (looking at student work)

Looking at student work

This week provided a great opportunity to apply ideas into practice centered around co-constructing criteria and looking at student work. The context comes from two fronts:

At school we spent a few days with Sandra Herbst and Anne Davies (see previous blog post) and have been putting into practice their work on co-constructing criteria with students, both as a means to clarify student’s work towards a higher level of quality, as well as create a sense of agency in students over their work, as they adopt a growth mindset about how to improve their work.

The Deeper Learning MOOC (http://dlmooc.deeper-learning.org) had a focus this week on Examining Student work as well. The conversation on Monday (video archive here: http://dlmooc.deeper-learning.org/live/archives/#012714) was a panel discussion (Joe McDonald, Ron Berger, Rob Riordan, Steve Seidel, Carissa Romero amongst others) about how and why we examine student work. In quick summary, we look at student work for at least 2 important reasons:

– To help us better understand what students are taking away from our instructional implementation. What skills and knowledge have they acquired?

– To help improve our professional practice. In what ways can we use this work to help future planning and revising our work for a better effectiveness?

During the conversation that happened, Carissa Romero from Stanford talked about her work with helping math teachers develop better strategies and mindsets in students. Since we were in the midst of some challenging conversation around approaches to solving systems of equations, I thought I would apply that to our work this Wednesday. Students were assigned a problem after having watched a couple of Khan Academy videos (a modified ‘flipped lesson’) and used to their tables to map out solutions as a group. We then did a gallery walk of their work table by table. Some examples of their work here below:

photo 2

photo 3

photo 1
Instead of just looking at the work, one of the things we talked about as a class for each solution was “what are some examples of good mathematical process we see here? What are some things that could have made this work stronger?” This line of questioning and recording it helped identify elements of good mathematical work, and created a sense of ownership (agency) around those criteria that determine what a good mathematical solution look like.

In another example of co-constructing criteria, we had students finalizing their schematic diagrams that they created for their display projects. Students are locating a place on campus and designing an exhibit space for student work. Before they can create their prototypes to show our admin team, they were required to turn their conceptual ideas into schematic drawings represented as orthographic projections. We just finished doing this work two weeks ago on miniature catapults, so it was the perfect time to reach consensus around what elements we should see in a good schematic drawing. We put up examples of student work, and asked the students to consider what elements they think were strong, and what things they want to make sure these drawings had for them to be useful and appropriate. Their list included criteria like:

– use of pencil and protractor to draw all lines and curves
– scale included as a legend
– three views minimum
– attention to detail
– neatness of sketches and text that describes
– measurements given along major directions

We then agreed that these are the ways by which we should judge the quality of their work, and they set to rework their diagrams to be more aligned with these criteria

photo 1-1

photo 2-1

photo 3-1

photo 4
The level of student work in both their writing and their drawings went up dramatically. We just collected these documents on Friday, so I make sure to include some images from this work next week.

Co-construction, construction, and constructivism

Blog post
co-construction, construction, and constructivism

okay – been too long getting out a blog post, sometimes 1000 word posts are too daunting and as a result get put off and put off until topics are lost in the flurry of life’s busy activities. This post will focus on work currently in progress and things that tied to that from recent professional development work.

Co-Construction
Last week Anne Davies and Sandra Herbst spent two days on our campus and worked with the majority of high school staff conducting sample lessons, leading conversation and challenging our notions on instructional design and how we evaluate and assess learning. Some of my favorite thoughts from them:

** assessment derives from assess which means “to sit beside”

** assessment has three data legs to stand on for valid triangulation: products (artifacts), observations, conversations

** “we build on success” – an important thing to remember – work on strengths

** “students choosing to engage” – how do we make it possible?

** saying the issue or problem louder or more frequently will not improve the situation

To that end, they led some sessions that showed ways to get to co-construction of assessment criteria and expectations. This week I had my kids do a modified version. We looked a 6 different blog posts from this weekend that were supposed to be a reflective summary of what we had done the past week. In teams of two they read 6 anonymous reflections and noted at least 3 parts they thought were strong and noted why, and looked for elements they thought could be better and noted why.

We then complied this list on the board – this is what they came up with:

MPX reflective blog rubric

We next looked a pre-made rubric for evaluating student reflective blogs. (here: https://www2.uwstout.edu/content/profdev/rubrics/blog_rubric_revised.pdf) They looked at the criteria and identified wording and sections they thought were strong. Not surprisingly (to them or me) the wording was different, but the criteria and descriptors were very much like their own.

We discussed which we would rather use and we decided it was more powerful to use our own language so we will clean this up next class and use it to evaluate our work from here on out.

Construction
One of our projects this semester is to design, prototype and build a water park ride (seriously). To get there I am having them first build a scale model of a catapult that I found on this website: http://www.stormthecastle.com/catapult/mark-thomas-modified-ogre-catapult.htm

This is the instructions I gave them:

Catapult Prototypes:

Our goal today is to build a scale model of the catapult that we see on this page:

http://stormthecastle.com/catapult/mark-thomas-modified-ogre-catapult.htm

we will eventually make the actual model, but in order to see the construction requirements, a scale model is a good way to start.

Schematic diagrams

to start, you are to make a three view schematic diagram so that you’re both aware of the materials needed, as well as how they fit together and other design considerations. On one piece of graph paper, accurately and completely create top, side, and front view diagrams making sure to include all important measurements and edges, drawn accurately and with straight lines using a ruler and labeling all parts as necessary.

please look at these presentations about how to make a scale drawing:

http://www.authorstream.com/Presentation/Tirone-38765-Orthographic-Projection-Multi-View-Drawing-History-Revolving-pr-Education-ppt-powerpoint/

http://www.authorstream.com/Presentation/waqqas-314623-orthographic-projection-education-ppt-powerpoint/

Here are a few examples of what a good three view representation should look like:

http://image.thefabricator.com/a/articles/images/2249/precision-large-view-figure5b.gif

http://www.dimcax.com/gdt_web/november-04_files/july-02-1.gif

http://upload.wikimedia.org/wikipedia/commons/thumb/4/45/Mech_draw_1.svg/200px-Mech_draw_1.svg.png

http://graphicalcommunication.skola.edu.mt/wp-content/uploads/2010/09/Engineering-Drawing-1.jpg

http://engineeringtraining.tpub.com/14069/img/14069_162_6.jpg

http://graphicalcommunication.skola.edu.mt/wp-content/uploads/2010/09/Form-4-HYE-2009-010109-Model-11.jpg

Once you have created your schematic orthographic drawings and have them approved, get your materials and build a 1/4 scale model of the catapult.

materials list
four sets of chopsticks
two drinking straws
one metal rod
four paperclips
glue gun
four rubber bands

The first step was taking the pictures of the Modified Ogre design and turn it into quality orthographic diagrams on graph paper or digitally on notability. One student asked to use a CAD software package and translate that into orthographic drawings – pretty cool idea.

I budgeted 30 minutes to do the drawing **Big Mistake** over an hour in, it became clear that creating quality drawings from the pictures was more challenging than I thought. Some students started to get close:

nikki schematic

bobby catapult schematic

Once they finish the drawings they will construct the 1/4 scale model, then we will move onto the actual construction in a week’s time. More to come on this adventure. The real goal is three fold:

** re-touch on the design process before we launch into the water park slide
** re-aquaint and add epetise on pwer tools in our mpx maker space so we can use them well
** understad the kinematic equations around projectile motion and the concepts of mementum and energy that a good ccatalpuly challenge will require. That will build on our Phyics knowledge AND our understanding and use of solving quadrtics from Apgebra 2.

Constructivism

Lastly we are reviewing all of Alg 2A (first semester Algebra) by taking a Chapter at a time and working through traditional problems for practice and self-checking against our math standards. We are doing this in a modified “Flipped” approach – I have them review the information (including a few key Khan academy videos) before they come to class, then they work through some practice problems sets during class time with guided help from each other (first) and me (second). The goal is to have LOTS of mathematical conversations as we work towards solving the problems. What is interesting to me is though it more than not a traditional approach (albeit flipped) the students more than not like this approach – the practice – this is some of their comments from their reflective blogs:

I had some trouble on the math because I don’t think we worked on problems like that earlier in the year but I do find it helpful that we are learning basic math like the other classes. I am not very confident in math but I do catch on with a good explanation. Sometimes I need to do a review because I often forget what we did a week after learning it.

I like how we are doing more math now, like Inequalities, patterns, and expressions. I am starting to get the hang of how to do these math problems. I think how we had to do the text book work was good because it is helpful and gets us ready for next year.

photo 1-3

photo 2-3

and there we are for this week…

Continuing to Rethink Math Design on light and on motion

Continuing to Rethink Math Design on light and on motion

Over the past two weeks, a couple of different opportunities arose to rethink the way to approach the understanding and application of modeling mathematical functions like inverse relations and quadratic relations. One of my goals is to tie these inquiries to work we are doing that is authentic, but when that is not possible, to at least root it in a real world situation or phenomena.

On Light

Over the past 2 months, our MPX 10 students have been learning the skills to complete successful energy audits (more on that in another post) and one of the pieces for that is examining lighting in spaces and judging not just the cost (determined by wattage of bulbs and frequency of use) but also whether there are options to “de-lamp” in situations where there are too many bulbs causing spaces to be overly bright. Students learned how to use a light meter, terms like luminosity, intensity, units like lumens, lux and footcandles and what appropriate light levels should be.

In the midst of this, it became clear that we could examine the relationship between light intensity (in lux) and distance which was a natural fit for our work. The activity sheet below was designed to have students investigate this phenomena. I have converted it into a jpg so it is readable through this web page:

Activity sheet for investigating light

light04

light06

light08

light07
This investigation was real world, because there were all kinds of design issues – how far and what intervals to measure, working between scale levels in the meter, effects of ambient light and reflection from nearby surfaces. In the end there was a clear inverse relationship detected, but 4 different math models arose:

I = a/d — an inverse relationship
I = a/d^2 — an inverse square relationship
I = ad^n — a power relationship where n was a negative number between -6 and -2
I = a/d^n + b — a nth inverse relationship – most students got n=-2 – an inverse square relation

This really gave us two excellent opportunities for discussion that I have not anticipated!

I had the students whiteboard in their groups their data sets so that we could have a discussion as assigned to the community about our findings. Some of that work here:

photo 4-2

photo 3-2

photo 2-2

photo 1-2

First of all, in considering experimental design, even though in general we agreed that light intensity decreased as distance increased we needed to consider what it meant that 4 different solutions arose. Error from ambient light greatly affected the results and was difficult to control for.
More importantly, the general idea in science that we should look for simple relationships needed to be addressed when some groups were stating relationships like I = a/d^.621

Secondly, the opportunity to discuss the series of curves generated by the functions list above let us discuss why I = a/d^n + b is a more general form of the other functions. Even though we didn’t go into the complete depth I would have liked on this, it will lead to a better understanding of how to find form and function in real data that we will continue to loop back to all year.

Here are a few summary documents (pdf format) by students in the class:

kai light lab

ethan light lab

isaiah light

On Motion

Although we will continue to work on our energy auditing with community members, we are moving on to understanding motion which serves two purposes – kinematics, the study of how things move and dynamics, the study of why things move. These core physics topics have been shown for many years to be the fundamental gateway for students entering college that need to take physical science whether it be engineering, medical school, architecture for example. To that end, our next round of activities will focus on having students understand motion, with the goal of designing a project that we choose as a class that will help us explain motion.

Beautifully tied to this, is the mathematics of kinematics, which involves multiple representations of polynomials and quadratic’s which are significant part of algebra 2.

To get us started in examining these mathematical underpinnings, we conducted an experiment last week in which students measured distance and time for an object rolling down an inclined plane. The activity sheet, which is not as well developed that some of the others I’ve done is below:

modeling motion inclined plane

One of the things that excited me about conducting this experiment, was rethinking the design of this traditional kinematics investigation. Usually, timing the motion requires using computer aided systems like a photo gate, or a tickertape. As I was thinking of ways to quickly collect accurate data, I was wishing that the camera on the iPad inserted timecode, and then realized that if students filmed the phenomena within iPad timer in view, they could slow down the motion and measure the times accurately by reading off clock measures as the object slid down the inclined plane.
Here are a few photos of the experiment in action:

photo 3-1

photo 1-1

photo 4-1

photo 2-1

keeping in mind that the goal of experiment was really twofold:
begin an understanding of accelerated motion which will tie to our working kinematics
examine relationships that pose interesting quadratic challenges to investigate mathematically
the data lends itself beautifully to both of these goals, and we will unpack their findings this week – but here is a preview of what a one of first draft writeups looked like already:

bobby motion lab

onward and upward!

On the PSAT, looking at Energy and Art in Math

On the PSAT, looking at Energy and Art in Math

The past week and a half have seen us focus as a class on three main threads.

The PSAT
Every one of our sophomores takes the PSAT as a means to practice and acclimate that kind of testing environment so that when they take it again as it Junior they are more accustomed to it. In our program, that means an additional layer of testing with multiple choices, since we spend more of our time immersed in deeper thinking about what we know of math and less on practice and rote problem-solving. As a result, the students and I agreed we should spend time just about every day just doing some practice problems which will serve a couple of purposes: give us a better review of the types of math that they are expected to know, cover distinct strategies about doing well on the test, fill in the gaps of areas that they think would help them do better on this first pass at the test. So that end, we’re using resources like the practice tests on majortests.com, the College Board website, and resources that we’ve accumulated to support the math side of the PSAT. We typically start by taking a small number of questions, and then debriefing them either as a class or in groups to better deconstruct the mathematical thinking that underpins those questions.

Energy Auditing
While we are waiting for our full set of equipment to arrive, we have been doing group work tied to understanding how to evaluate a space for electrical energy footprint. Perhaps a example will help in that regard:
Today, their challenge was to take the data from an air conditioner that had been running for 27 minutes, then look at its kilowatt hour usage, and estimate how much it costs to run that device for a month (current Hawaiian Electric cost: $0.34 per kWHr). Once they had that determined, they were then challenged with going to a building, counting how many air-conditioners are in that building, and estimating what the monthly electrical charge is to run the air conditioners in that building. I’ve attached Josh and Kris’s sheet that they gave me as an example, there is also a bonus questions that they were given to determine what the cost should be to run a fan instead – you’ll see that on the bottom:

Josh and Matt's solution for the cost of running the air conditioner in my office

Josh and Matt’s solution for the cost of running the air conditioner in my office

The goal of all this initial work, is to create a more careful eye on their part, not just in being able to calculate correctly the energy usage of the device, but to also think about where these things are and how they might take a position with the client in helping them consider ways to save money and energy.

Math in Art

In my last blog post I talked a bit about the project we are undertaking to work with math and art. I just want to share a couple of artifacts that are still in their early stages, but they give a hint of the work that is to come. The pictures below is a shot of both a student hand-drawn art, and the mathematical models using Desmos that give an indication of how they can translate art into clear mathematical function and form.

Emma's art and math model (first pass)

Emma’s art and math model (first pass)

Student work mimicking Albers

Student work mimicking Albers

***the skill and process of critiquing***

One of the things we believe fundamentally is the importance of critiquing and feedback in improving student work and developing a greater sense of autonomy/agency in student work. Once the students completed their first sketch, they used post it note pads to give each other feedback following our agreements development from Ron Berger:

Be Helpful
Be Kind
Be Specific

Examples of the process :

IMG_2923

Thinking about helpful specific feedback

Thinking about helpful specific feedback

Blaine Critiques

Blaine Critiques

Josh leaves some ideas

Josh leaves some ideas

some critique on a draft

some critique on a draft

student critiquing

student critiquing


the students did blog posts last week in which they talked about their first round of drawings, the feedback that they received, and their directions. Here are two nice examples from? And? That show where they’re at and give some hint of where they’re going.

More updates to come in another week…

Exploring Math in Art and BIG electricity

On Math in Art and Big Electricity

This is a summary of our activities of our work in MPX STEM 10 from the week of Sept 9 as well as some glimpses of where we are going.

My work on trying to create hands-on engaging MAth activities and projects continues. This past week I was trying to find ways to more fully investigate inequalities and thought a lot about the work done by Alfred Solis at High-Tech High and one of his activities that looked at creating art using mathematical functions here:
Alfred Solis

In the midst of this, I found a wonderful free graphing ipad app and website that I started using with my students to better understand everything from permutations, to just the complexity of mathematical relationships and how they represent themselves visually:
https://www.desmos.com

The combination of Desmos and the art piece from Solis have let me design a activity that investigates art through mathematical functions in inequalities although I’m still working on some of the final assessment rubrics, the document can be found here:

Before we started on the activity, we downloaded and installed the Desmos app, and explored linear and conic section functions in a 45 minute activity. One of the things we used to help us understand these were the examples of art on their website that show the ways that people have taken ellipses, hyperbola’s, lines and other math functions to create artwork. One of the beautiful things about this is that it reinforced the importance of defining domain and range, to limit the parts of a function that might be used to create an arc of limited size, for example. You can see some of these examples here
https://www.desmos.com/art

As you can see from my document, it walks the students through some basic steps:

** understanding the difference between bitmap and vector graphics

** looking at some geometric centered art in understanding its place both as art and historically (examples below)

Cubism example from Picasso

Cubism example from Picasso

A piece from Albers

A piece from Albers

Kadrinsky

Kadrinsky

Mondrian

Mondrian

** creating a draft of one type of art that they would like to explore in pencil

** a round of feedback to improve the drawings (our consistent effort to model the work of Ron Berger)

** a final color to drawing based off of the improved sketch

** mapping the coordinates of the final color drawing to determine the mathematical statements that need to be constructed to mimic the art using the app Desmos, constructing the model mathematically

Last week the students worked on steps one and two, and in class this week they will be working on their sketches and giving feedback – one student has already jumped ahead and am pleased already with what I see for a first draft here:

A little Kadinsky and Mondrian

A little Kadinsky and Mondrian

On my next blog post, I’ll update where we are at – hopefully will have colored drawings and maybe some coordinates mapped out.

Our other big event of the week was a field trip to the Hawaiian Electric (Heco) power plant at Waiau. In an earlier blog post, I commented on the work we’ve been doing utilizing the Castle curriculum to better understand electricity. The goal of this has been to lead us to have a good working understanding of electrical energy as we conduct energy audits. In order to anchor the work were doing in a more real way, it was time to visit an actual place where electricity is generated on an industrial scale. Led by Marshall Costello, the senior supervisor for training, the staff at the plant were excellent in both talking about how electricity is made, the historical background of power in the islands, and current plans for diversifying the ways that electricity is made and supplied to residential and business customers in the islands. Certainly, the real excitement came from the walking tour in which they took us through the main steps involved in conventional electric power generation:

burning some fuel to create heat energy
creating steam under high heat and pressure to turn a turbine
using the turbine to spin a generator
distribution of the output of the generator through cables and transformers

HECO graphic of electrical generation

HECO graphic of electrical generation


The students asked marvelous questions that ranged from the type of fuel that is used to the plans to diversify with photovoltaics, wind and wave energy and ocean thermal conversion.

Many thanks to Marshall and his crew provided such an excellent learning opportunity for our students! they invited us to come back later in the year if we need more information to help with our research and our community active role.

Turbine and Generator = 40 MegaWatts made right here!

Turbine and Generator = 40 MegaWatts made right here!

Sean checks out the boiler where they inject the oil to create the fire ball

Sean checks out the boiler where they inject the oil to create the fire ball

Heading up to Waiau 7 one of 8 units at this facility

Heading up to Waiau 7 one of 8 units at this facility

Control room for Waiau 7 & 8 - all the process is controlled from here

Control room for Waiau 7 & 8 – all the process is controlled from here

The screen the operator sees - only 3 people work the entire unit in any time block

The screen the operator sees – only 3 people work the entire unit in any time block

Walking out towards Waiau 7&8

Walking out towards Waiau 7&8

Transformer that takes the electricity from the generator and steps up to 13 kV

Transformer that takes the electricity from the generator and steps up to 13 kV

Briefing from Marshall Costello and his crew

Briefing from Marshall Costello and his crew

Old decommissioned control room from 1950

Old decommissioned control room from 1950 – Note the old school analog displays

Math Activity design: Modeling Linear functions

Mathematical Modeling, Authentic Math Activities and Standards

One of my goals for this year is to create (or borrow liberally or adapt) hands-on, minds-on engaging and authentic activities to teach and practice math concepts – both those in our Core Content (in my case Algebra II) and from the Common Core (which our Math Scope and Sequence aligns with).

For this past week I was designing around the following MPI core concepts:

Relation Properties,
Domain and Range,
Functions Properties,
Function Notation Direct Variation,
Slope,
Slope-Intercept form,
Graphing Lines

Which loosely corresponded to the following Common Core Standards:

Understand the concept of a function and use function notation (F-IF 1,2)
Create equations that describe numbers or relationships (A-CED 2)
Interpret functions that arise in applications in terms of context (F-IF 4, 5, 6)
Analyze functions using different representations. (F-IF 7, 8, 9)
Build a function that models a relationship between two quantities (F-BF 1)

My goal was to construct an experience that students would design and implement an experiment that would make them collect, analyze and model a behavior in the real world. This is what is looked like:


Mathematical Models and Modeling Functions
Goal: To design and practice the common core standards around linear model functions
Step 1. Define and design an experiment that you can conduct with existing classroom equipment that will generate a set of at at least 6 data pairs to examine the relationship between two variables of your choosing.
Your goal should be for this data to test a hypothesis that the relation is linear.
You must get permission for the teacher to move forward to step 2. You must define:
• your purpose
• your independent and dependent variables
• your anticipated domain and range
• your rationale for why you expect a linear relationship • your apparatus and procedure
Step 2: Conduct the experiment. Make sure to run AT LEAST 3 trials to minimize error.
Step 3: For your submitted report, you must complete the EVALUATION section of our standard lab report:
a table of calculated values
a graph that includes appropriate axes and labels as well as attempts to linearize your 
data
a statement of the relationship
a mathematical model of the data, including slope and intercept with correct units. 
(This should be in slope intercept form)
a brief discussion of the results and any divergent issues

The students proposed a variety of very interesting experiments (see below pics) – and although not all would actually lead to direct relationships, part of the ‘game’ was not pre-judging for them what might occur. That in itself led to some interesting conversations about best fit lines, the shape of data, and how we know what kinds of relationships are happening between variables in our experiments.

time it takes a ball to drop from different heights

time it takes a ball to drop from different heights

how does mass affect a pendulum's period?

how does mass affect a pendulum’s period?

time it takes a cylinder to roll different distances

time it takes a cylinder to roll different distances

does the mass/size of paper airplane change its travel distance

does the mass/size of paper airplane change its travel distance

time it takes a ball to roll through different amount of pegs on a surface

time it takes a ball to roll through different amount of pegs on a surface

comparing height of drop and bounce height for a tennis ball

comparing height of drop and bounce height for a tennis ball

classroom in experimental mode - students acting as scientists and mathematicians

classroom in experimental mode – students acting as scientists and mathematicians


So how did it go? I think the notion of creating real opportunities to practice and implement our mathematical understanding are the places where real mathematicians and the habits of minds of mathematics at her. Certainly, it exposed areas where students were still unsure about something as simple as slope intercept form, or what kind of relationship a scatterplot of data that is not quite linear means. All in all, it lends itself to working and thinking as real mathematicians and scientists, which is the goal of a good STEM education. Here are two examples of submitted work from the activity (in pdf format):

slinky

Bounce Height of a Tennis Ball copy
So what’s next? The work that’s coming up next deals with inequalities, and so I’ve been inspired by some work that Alfred Solis did when he was at high Tech high on the connection between art and mathematical form. More to come on this in the next week… A little hint of where were going below:

can we create a mathematical model of this?

can we create a mathematical model of this?

On constructivism and modeling

Constructivism, models and transfer learning

Full disclosure alert: regardless of anything else I do or say, my fundamental belief in education comes from a fully constructivist framework. For those that care to get philosophical, this is based on work that dates back long before Dewey, but we could use him as a starting point for why experience and real, hands on, meaningful work are not just a good idea, but truthfully the only real way to get to the understanding of anything in the real world. That isn’t to say that there are times that telling kids something doesn’t have meaning, but when that won’t be grounded in a real experience or useful information or transfer it is not likely to have much usefulness or long-lasting effect.

“We only think when we are confronted with problems” – John Dewey

This week in our class we have been continuing our work utilizing the CASTLE curriculum that was designed by Mel Steinburg at Smith College and has been implemented for many years as an effective means to have students learn and apply a useful model for what electricity is. Brief description of that here:http://www.pasco.com/prodCatalog/EM/EM-8624_castle-kit/.

The power of this curriculum is that it is not teacher directed in the sense of lectures, but instead is unfolded as a series of investigations to try and understand how and why simple circuits with batteries and light bulbs work the way they do. I was first introduced to this curriculum in the mid-1990s at Arizona State University in the most excellent Modeling Workshop series which I still think is the finest professional development activity I’ve ever attended. http://modelinginstruction.org

photo 4

conversation and group checking of ideas

conversation and group checking of ideas

Trying to make meaning of what we see happening

Trying to make meaning of what we see happening

photo 2

a tea assembles a circuit to investigate

a tea assembles a circuit to investigate

This week’s opening activities had students trying to understand what is going on in wires when we connect batteries and lightbulbs together. I know an outsider might say “we’ll just tell them that electricity moves” – but good research and a constructivists pedagogical approach understand that knowing something and understanding something are two different things. All of my students already know about electricity – but none of them truthfully can apply the ideas to answer discrepant or novel phenomena – critical if we are to transfer the knowledge we have to solve problems. In our case, our students will eventually be using this knowledge to help members in our community (school, home, a larger community) find ways to save both money and environmentally friendly sustainable activities in their energy use at home.We will do this through the process of energy auditing with specific recommendations to improve efficiency and lower energy use and cost.

So what about this business with knowledge and learning? When do we teach something, and when do we let students develop it through real-world experience?
There is a marvelous discussion by Marc Chun, of the Hewlitt foundation about the importance of ways to build transfer that I think are relevant to this conversation here:

You will notice that he refers to this kind of learning as “deeper learning”. One of my goals over the last year has been to more closely tie the work we are doing in our MPX program and at the school in general to this deeper learning movement that is taking root across the country. More info on deeper learning here:
http://www.hewlett.org/deeperlearning

That’s all for today, but in the future I will need to add Why the question

“How do you know that?”

is so important. The value of making thinking visible through tools like whiteboards and thinking routines. The value of discrepant events to help expose naïve and experts thinking and what we understand in mathematics and science. why the work of Robert Gagne’s and his 9 events of instruction do fit in to project-based learning, and the value and challenge of instructional design as a whole.

On the Sins of Omission

On Sins of Omission

Anyone that knows me, knows that I have a few too many fingers into too many pies, but I suppose it’s part of my personality to take on a few too many tasks that I probably should. One of the pieces of evidence of that is the amount of emails, blogs, social media streams and magazines that come across my desk daily from a variety of sources in education, technology, science and design to name a few. As a result, sometimes these go directly to my trash or it into piles articles and magazines that I hope I can get back to but often don’t.

from: http://sonofadud.files.wordpress.com/2011/12/030-finger-in-every-pie.jpg

from: http://sonofadud.files.wordpress.com/2011/12/030-finger-in-every-pie.jpg

Why this confession? On Tuesday, I had a couple of hours free to plan, prep and grade and in my mailbox was the latest issue of Wired magazine. Honestly, I don’t even know how I ended up with a subscription, but most months I look at the cover and think to myself “not gonna have time to look at it this month” and put it in a pile to be thrown out two months later. This time, however, I opened up the cover because the title was “The Future of Design: Invisible. Beautiful. Everywhere.” Okay – I was intrigued. Given how much time we spend with our students talking about creating work of meaning and beauty, and our interest in future design I had to at least take a peek inside. What was obvious almost immediately was how beautifully synchronized the work in this magazine is with the kinds of ways we work with our students in our MPX program. Here’s just a few of the articles in the magazine that aligns so beautifully with the work we talk about, or could use as jumping off points to investigate something meaningful in ourselves and our community:
** the fall and rise of gene therapy – in which amongst other things they talk about using topographic maps and visualization technology to understand better viruses
** Argos satellite – a brief article with visuals about a satellite that maps daily movements of marine animals to better understand their behaviors
** how Internet censorship can actually increase the spread of viruses and malware
** going the extra mile – an article about the design of cars from the shell eco-marathon
** one gamers war on sexism – one woman’s work on gender and sexism in video games
** making the web a louder place – the impact of audio files in increasing democratizing voice on the Internet
** nuclear waste management
** Project collaboration using social media
** the chemistry of pool chlorination
** the technology of communication systems in the sky above us
** invisible design – the ways which technologies are becoming embedded ubiquitous and invisible

and that doesn’t even cover all of the short articles on a variety of topics. Do these topics present jumping off points for short or long-term inquiry? Absolutely. Whose job is it to provide opportunities for my students to find areas of interesting, provocative and meaningful research – mine.
Two challenges, then, for me as the lead thinker in my classroom – how to create time and structure so these incredible conversations about present and future can be embedded as a part of our daily work, our passions and thinking, and ways that we position ourselves to take an active role in shaping the future.

So I’ve gone public with my need to not let these powerful opportunities just slide by my desk in the rush of the day-to-day, in the words of Ian Jukes “the tyranny of the urgent”

Hopefully we’ll see examples of that in our work this year…