
On Math in Art and Big Electricity
This is a summary of our activities of our work in MPX STEM 10 from the week of Sept 9 as well as some glimpses of where we are going.
My work on trying to create hands-on engaging MAth activities and projects continues. This past week I was trying to find ways to more fully investigate inequalities and thought a lot about the work done by Alfred Solis at High-Tech High and one of his activities that looked at creating art using mathematical functions here:
Alfred Solis
In the midst of this, I found a wonderful free graphing ipad app and website that I started using with my students to better understand everything from permutations, to just the complexity of mathematical relationships and how they represent themselves visually:
https://www.desmos.com
The combination of Desmos and the art piece from Solis have let me design a activity that investigates art through mathematical functions in inequalities although I’m still working on some of the final assessment rubrics, the document can be found here:
Before we started on the activity, we downloaded and installed the Desmos app, and explored linear and conic section functions in a 45 minute activity. One of the things we used to help us understand these were the examples of art on their website that show the ways that people have taken ellipses, hyperbola’s, lines and other math functions to create artwork. One of the beautiful things about this is that it reinforced the importance of defining domain and range, to limit the parts of a function that might be used to create an arc of limited size, for example. You can see some of these examples here
https://www.desmos.com/art
As you can see from my document, it walks the students through some basic steps:
** understanding the difference between bitmap and vector graphics
** looking at some geometric centered art in understanding its place both as art and historically (examples below)
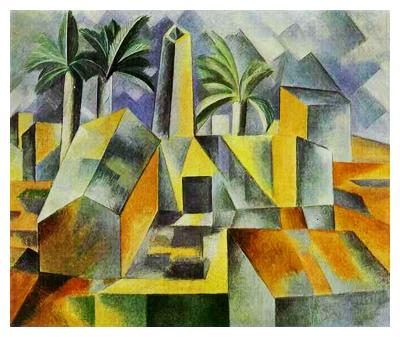
Cubism example from Picasso
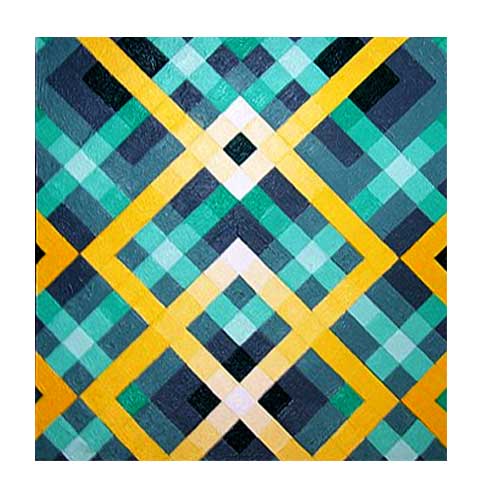
A piece from Albers
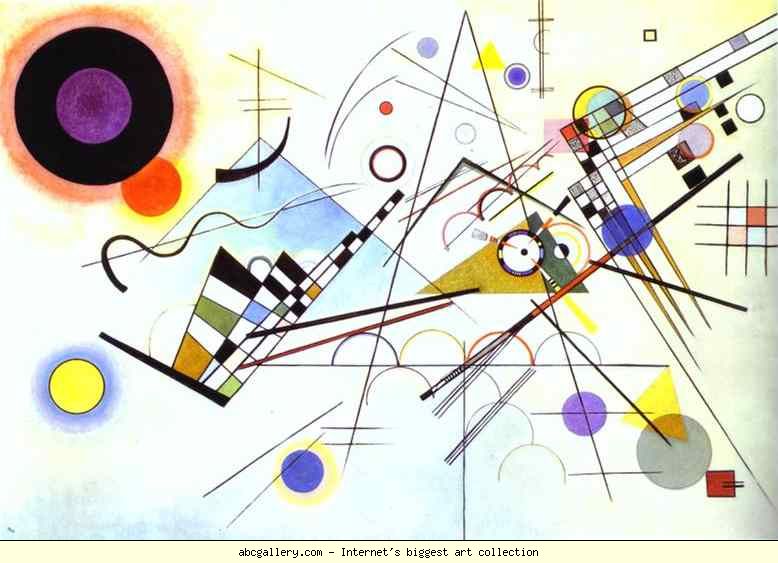
Kadrinsky

Mondrian
** creating a draft of one type of art that they would like to explore in pencil
** a round of feedback to improve the drawings (our consistent effort to model the work of Ron Berger)
** a final color to drawing based off of the improved sketch
** mapping the coordinates of the final color drawing to determine the mathematical statements that need to be constructed to mimic the art using the app Desmos, constructing the model mathematically
Last week the students worked on steps one and two, and in class this week they will be working on their sketches and giving feedback – one student has already jumped ahead and am pleased already with what I see for a first draft here:
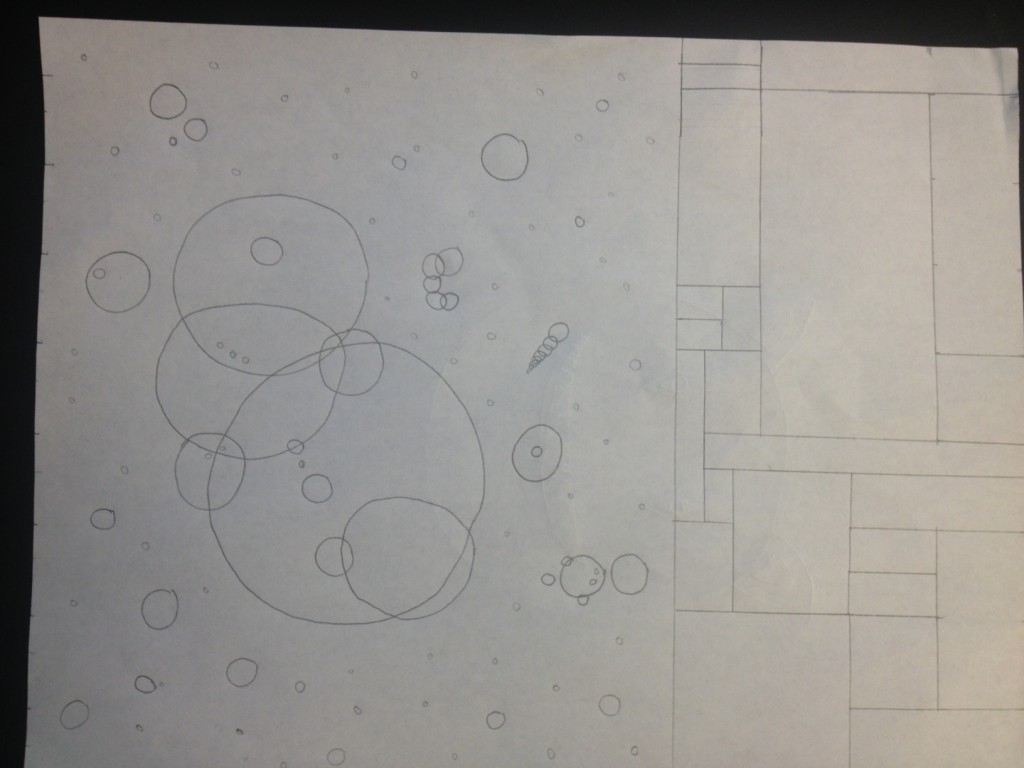
A little Kadinsky and Mondrian
On my next blog post, I’ll update where we are at – hopefully will have colored drawings and maybe some coordinates mapped out.
Our other big event of the week was a field trip to the Hawaiian Electric (Heco) power plant at Waiau. In an earlier blog post, I commented on the work we’ve been doing utilizing the Castle curriculum to better understand electricity. The goal of this has been to lead us to have a good working understanding of electrical energy as we conduct energy audits. In order to anchor the work were doing in a more real way, it was time to visit an actual place where electricity is generated on an industrial scale. Led by Marshall Costello, the senior supervisor for training, the staff at the plant were excellent in both talking about how electricity is made, the historical background of power in the islands, and current plans for diversifying the ways that electricity is made and supplied to residential and business customers in the islands. Certainly, the real excitement came from the walking tour in which they took us through the main steps involved in conventional electric power generation:
burning some fuel to create heat energy
creating steam under high heat and pressure to turn a turbine
using the turbine to spin a generator
distribution of the output of the generator through cables and transformers
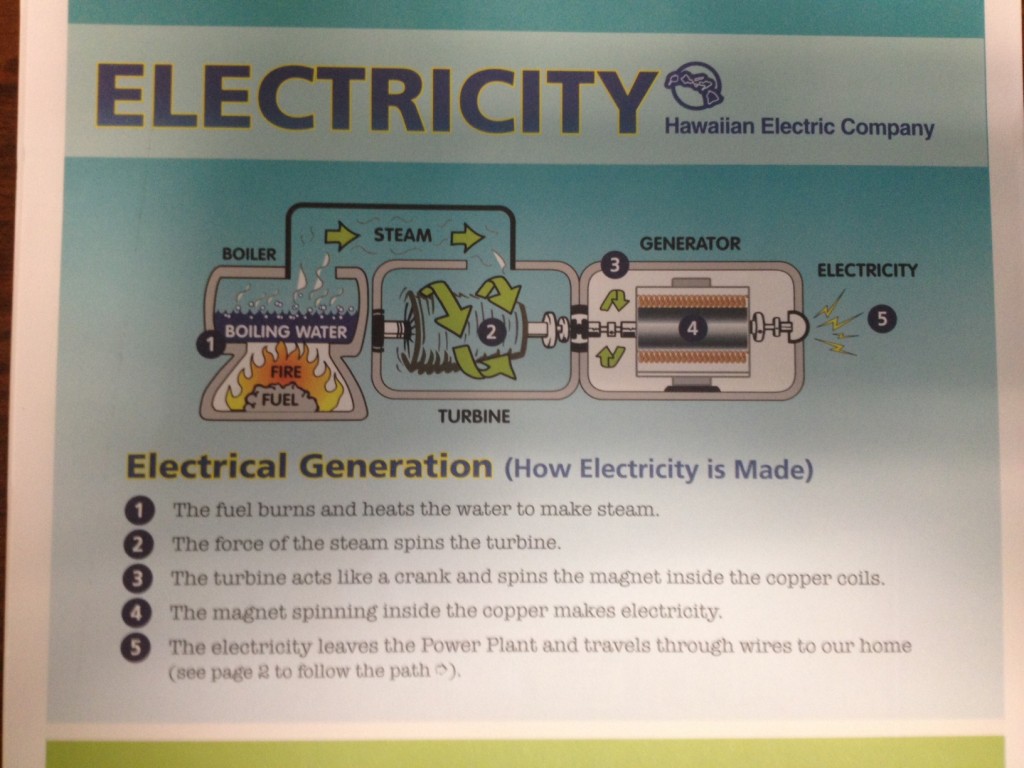
HECO graphic of electrical generation
The students asked marvelous questions that ranged from the type of fuel that is used to the plans to diversify with photovoltaics, wind and wave energy and ocean thermal conversion.
Many thanks to Marshall and his crew provided such an excellent learning opportunity for our students! they invited us to come back later in the year if we need more information to help with our research and our community active role.
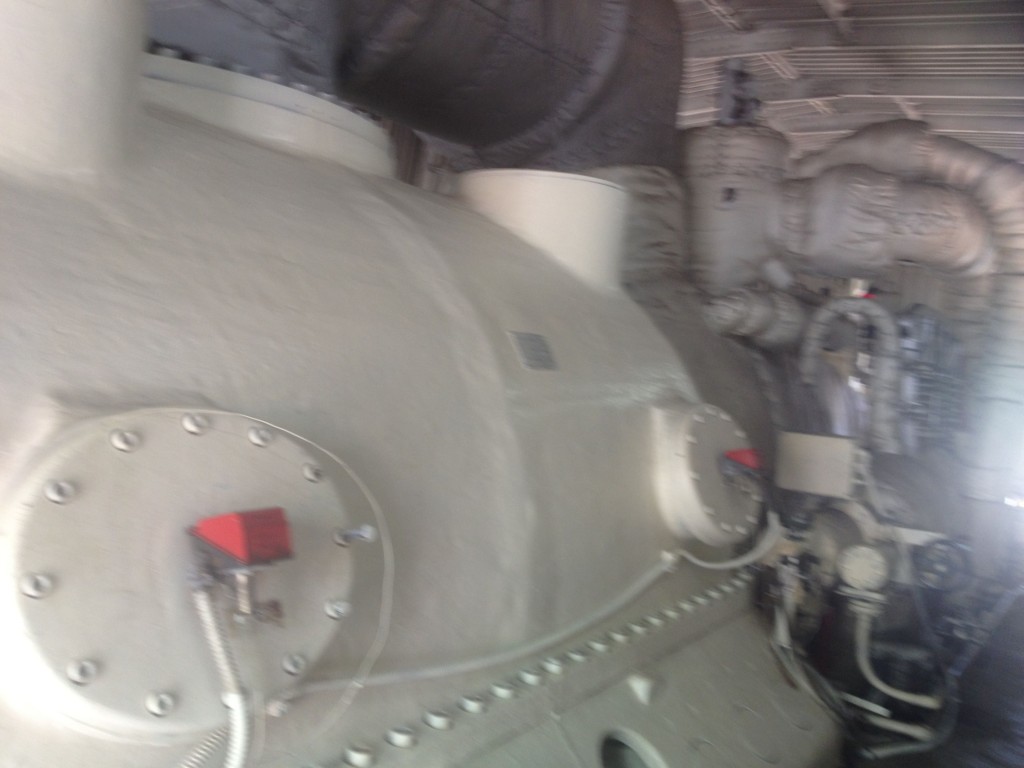
Turbine and Generator = 40 MegaWatts made right here!
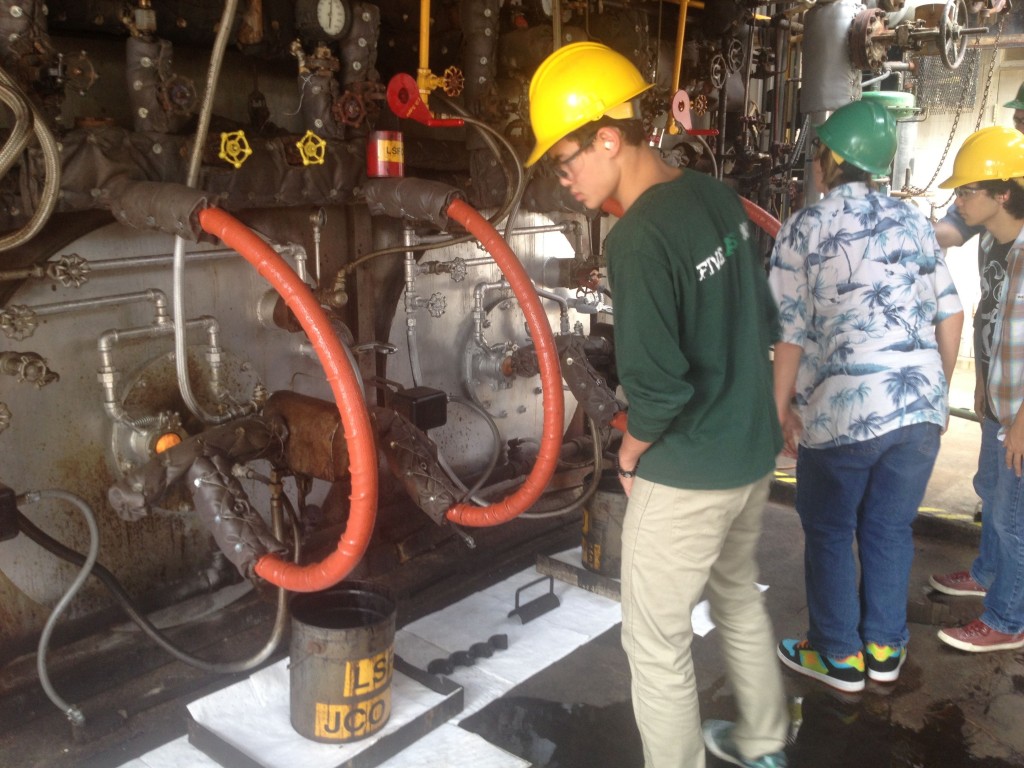
Sean checks out the boiler where they inject the oil to create the fire ball
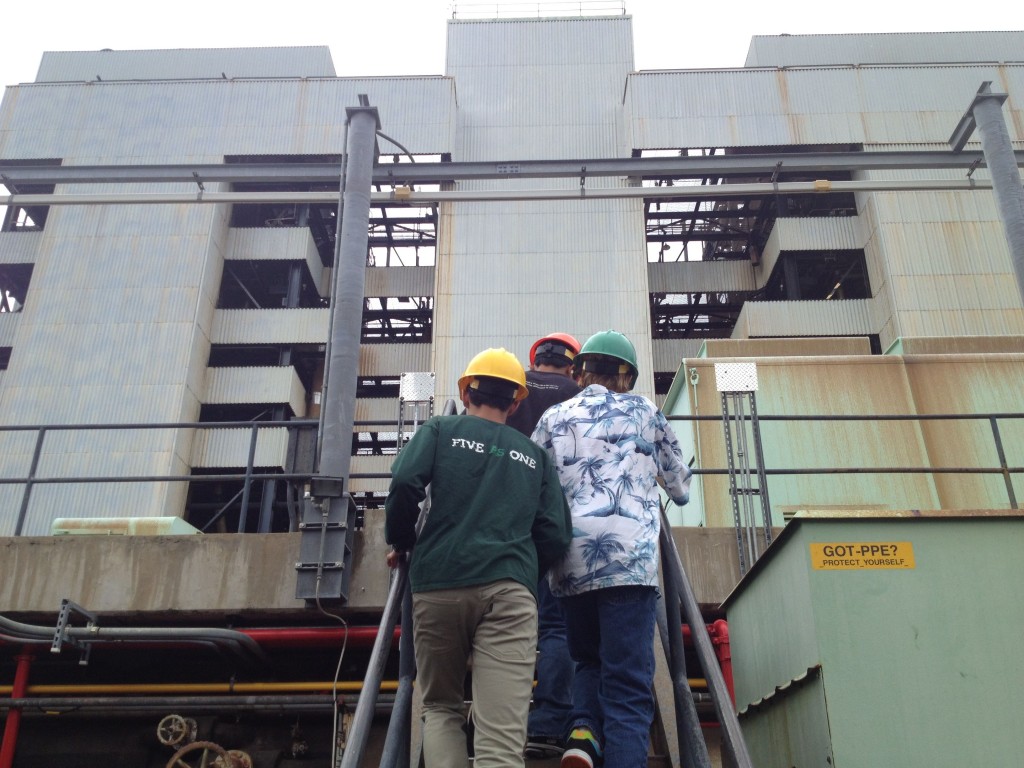
Heading up to Waiau 7 one of 8 units at this facility
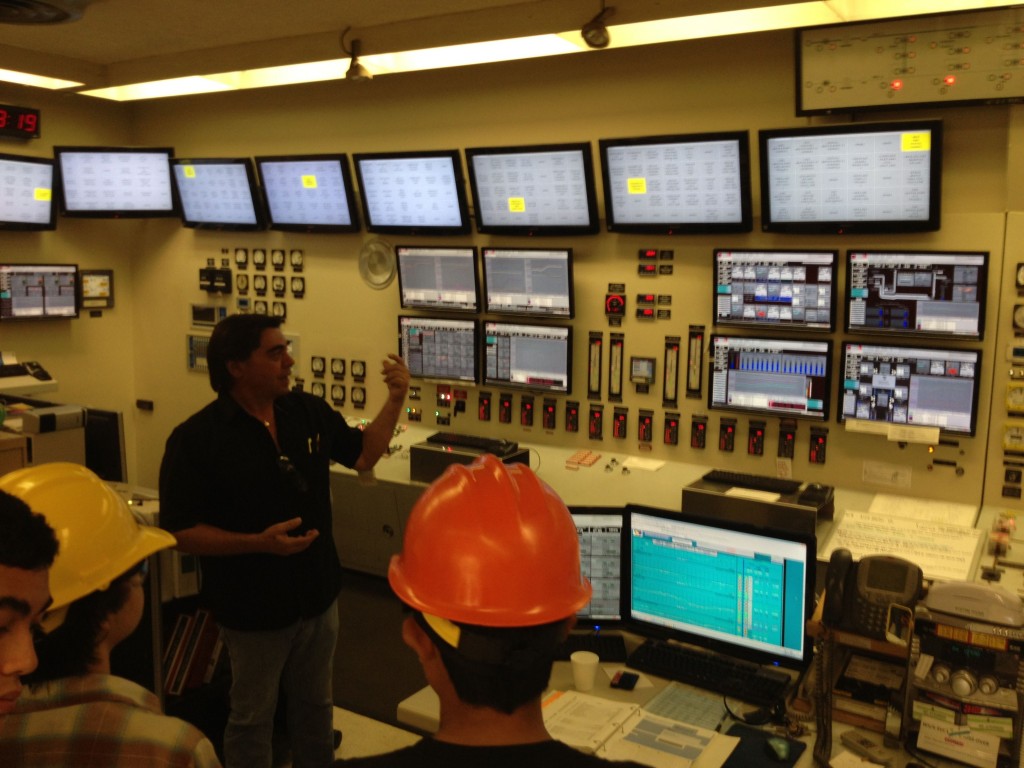
Control room for Waiau 7 & 8 – all the process is controlled from here
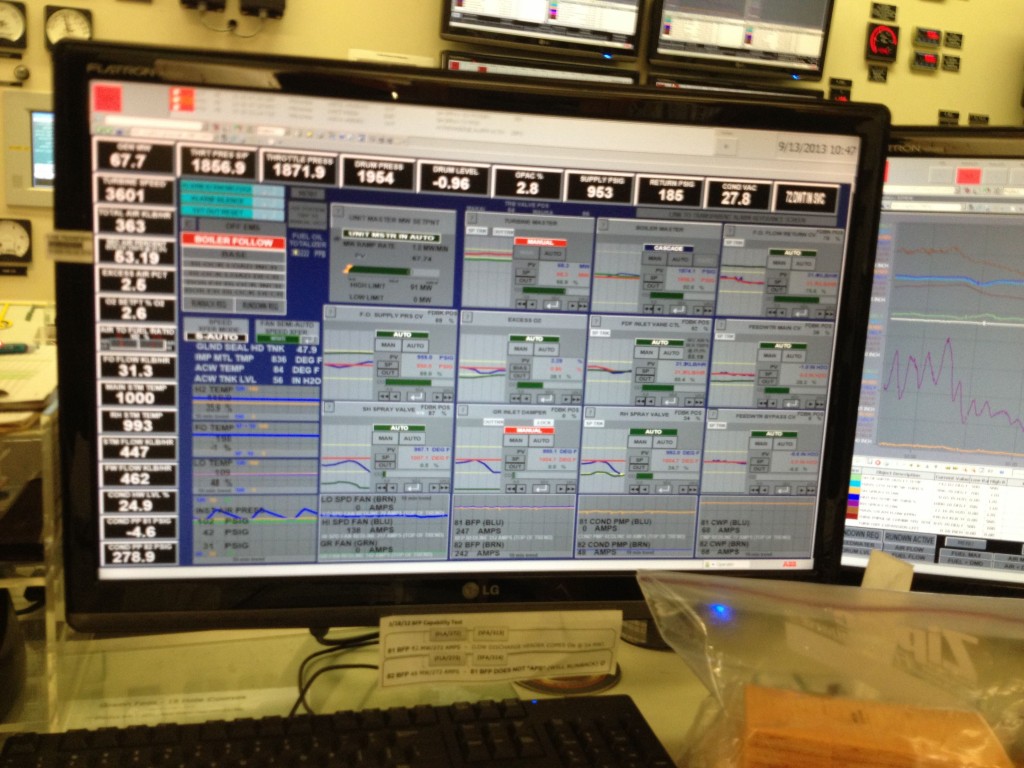
The screen the operator sees – only 3 people work the entire unit in any time block
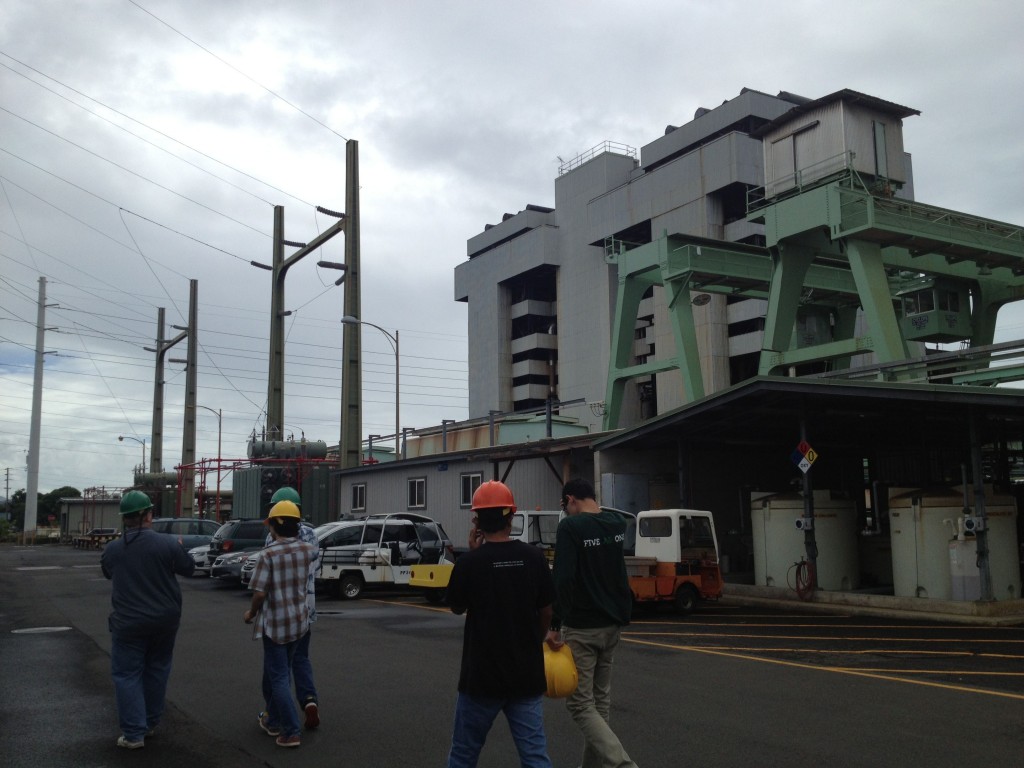
Walking out towards Waiau 7&8
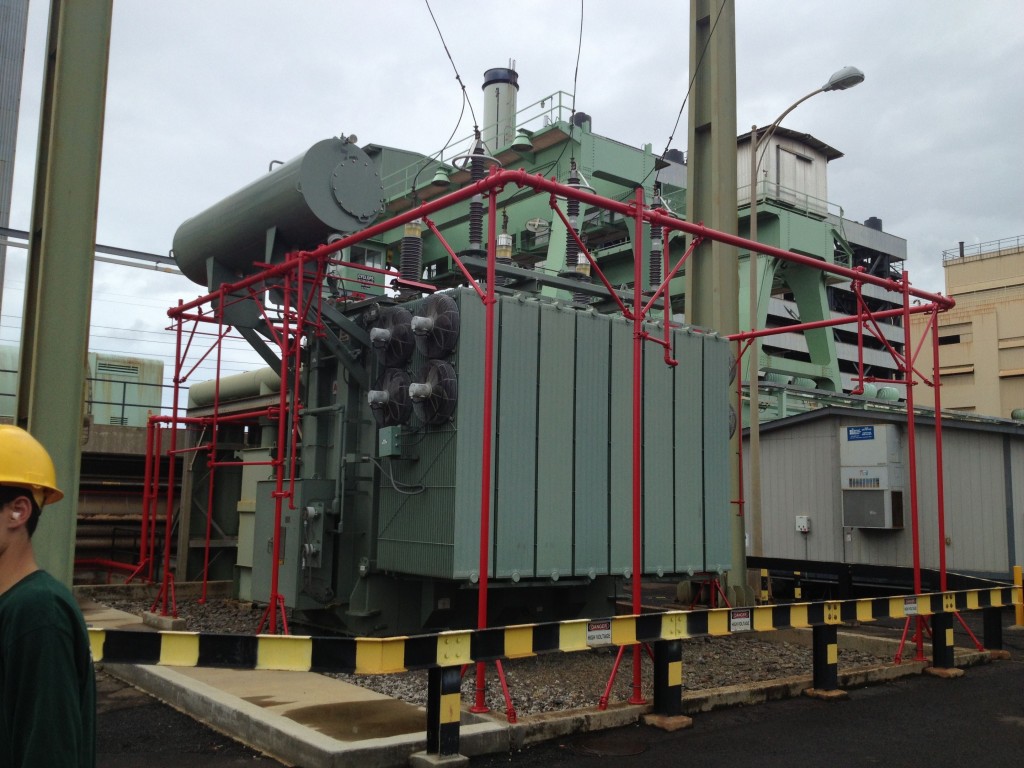
Transformer that takes the electricity from the generator and steps up to 13 kV
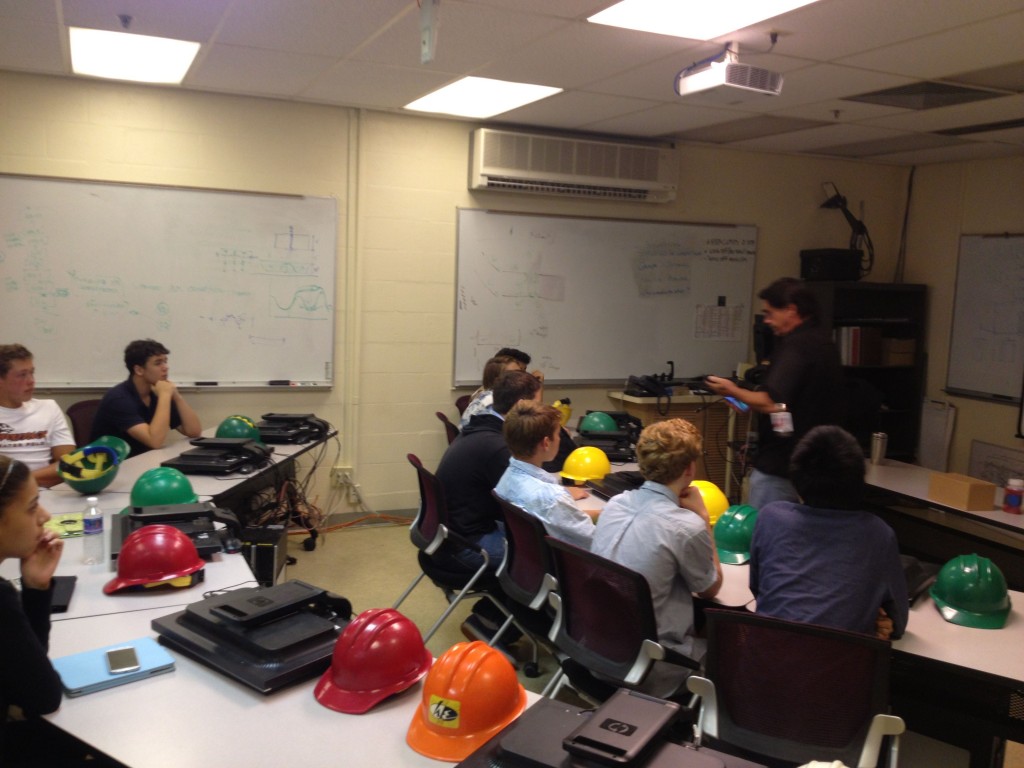
Briefing from Marshall Costello and his crew
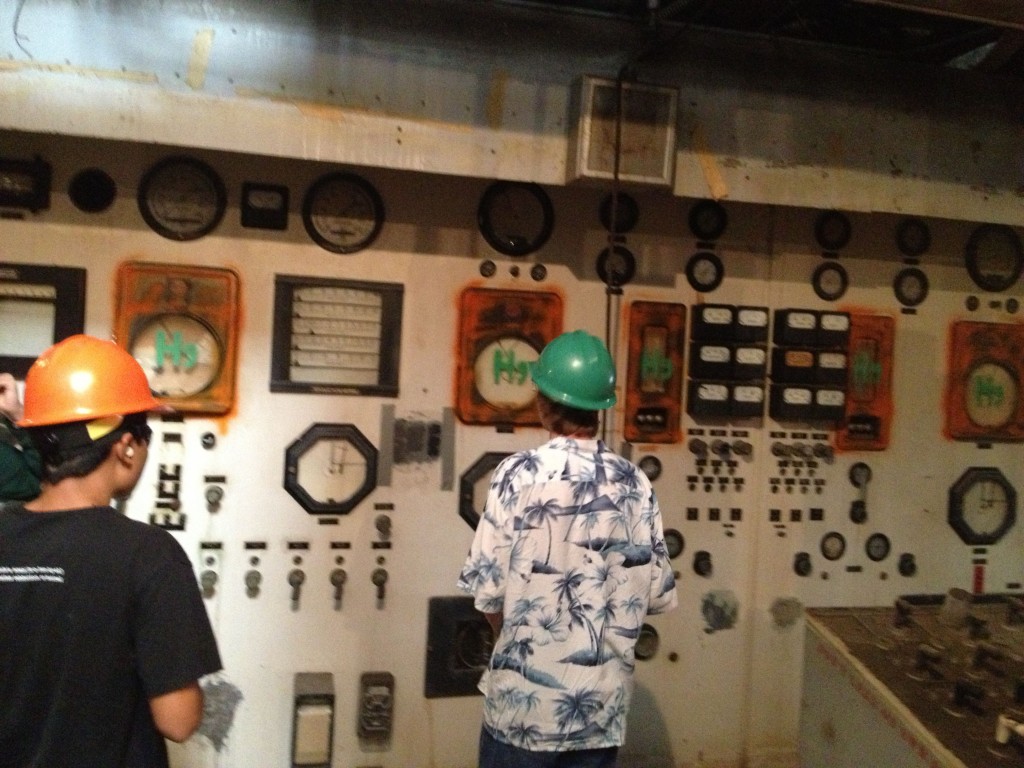
Old decommissioned control room from 1950 – Note the old school analog displays