
Mathematical Modeling, Authentic Math Activities and Standards
One of my goals for this year is to create (or borrow liberally or adapt) hands-on, minds-on engaging and authentic activities to teach and practice math concepts – both those in our Core Content (in my case Algebra II) and from the Common Core (which our Math Scope and Sequence aligns with).
For this past week I was designing around the following MPI core concepts:
Relation Properties,
Domain and Range,
Functions Properties,
Function Notation Direct Variation,
Slope,
Slope-Intercept form,
Graphing Lines
Which loosely corresponded to the following Common Core Standards:
Understand the concept of a function and use function notation (F-IF 1,2)
Create equations that describe numbers or relationships (A-CED 2)
Interpret functions that arise in applications in terms of context (F-IF 4, 5, 6)
Analyze functions using different representations. (F-IF 7, 8, 9)
Build a function that models a relationship between two quantities (F-BF 1)
My goal was to construct an experience that students would design and implement an experiment that would make them collect, analyze and model a behavior in the real world. This is what is looked like:
Mathematical Models and Modeling Functions
Goal: To design and practice the common core standards around linear model functions
Step 1. Define and design an experiment that you can conduct with existing classroom equipment that will generate a set of at at least 6 data pairs to examine the relationship between two variables of your choosing.
Your goal should be for this data to test a hypothesis that the relation is linear.
You must get permission for the teacher to move forward to step 2. You must define:
• your purpose
• your independent and dependent variables
• your anticipated domain and range
• your rationale for why you expect a linear relationship • your apparatus and procedure
Step 2: Conduct the experiment. Make sure to run AT LEAST 3 trials to minimize error.
Step 3: For your submitted report, you must complete the EVALUATION section of our standard lab report:
a table of calculated values
a graph that includes appropriate axes and labels as well as attempts to linearize your
data
a statement of the relationship
a mathematical model of the data, including slope and intercept with correct units.
(This should be in slope intercept form)
a brief discussion of the results and any divergent issues
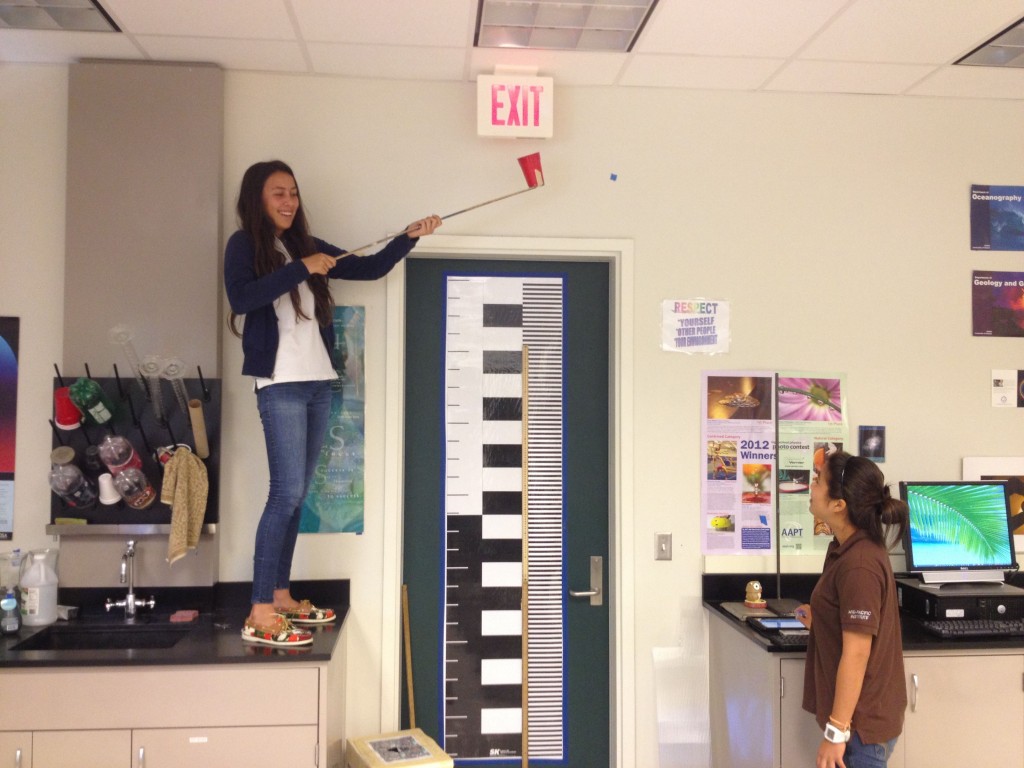
The students proposed a variety of very interesting experiments (see below pics) – and although not all would actually lead to direct relationships, part of the ‘game’ was not pre-judging for them what might occur. That in itself led to some interesting conversations about best fit lines, the shape of data, and how we know what kinds of relationships are happening between variables in our experiments.
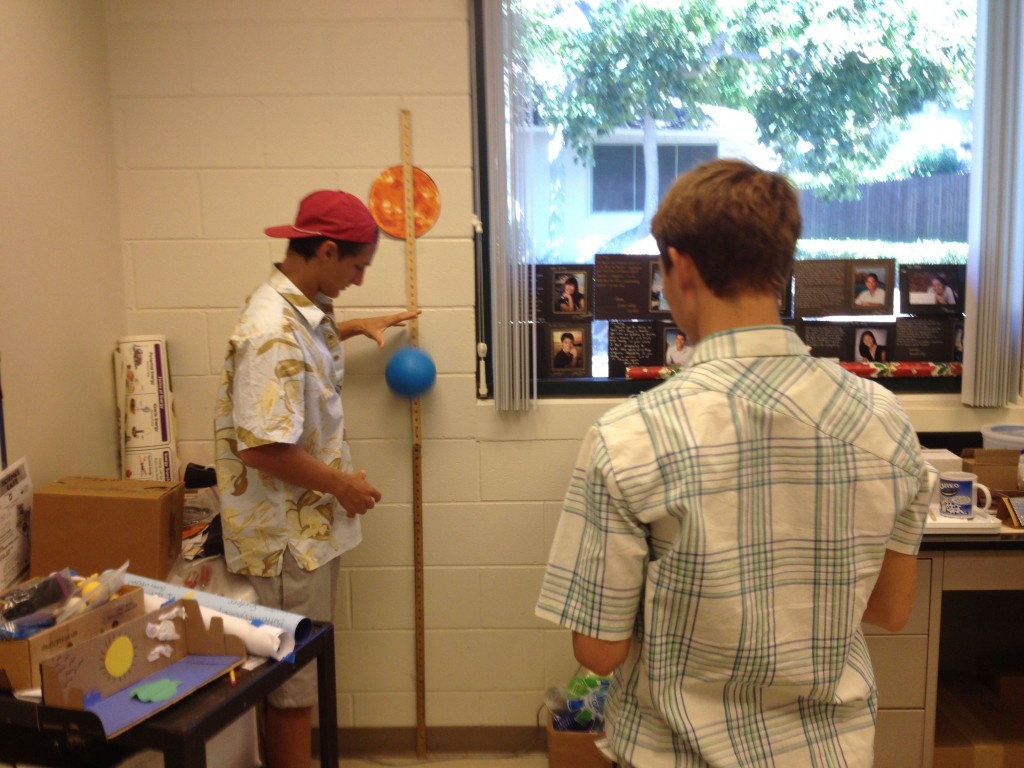
time it takes a ball to drop from different heights
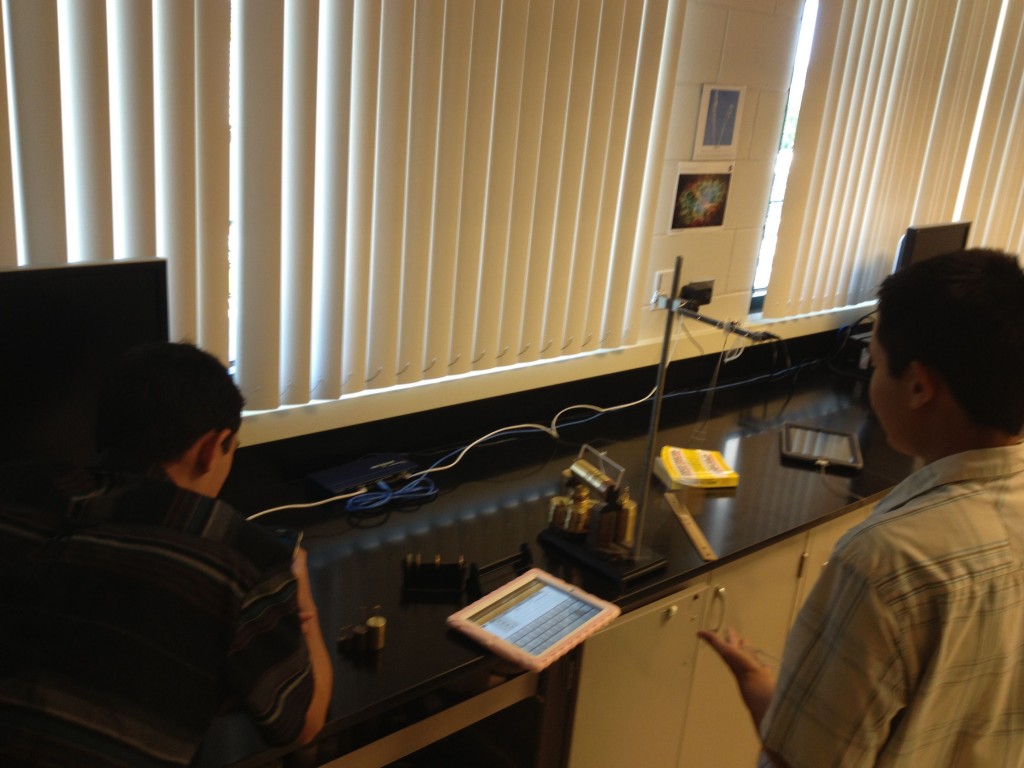
how does mass affect a pendulum’s period?
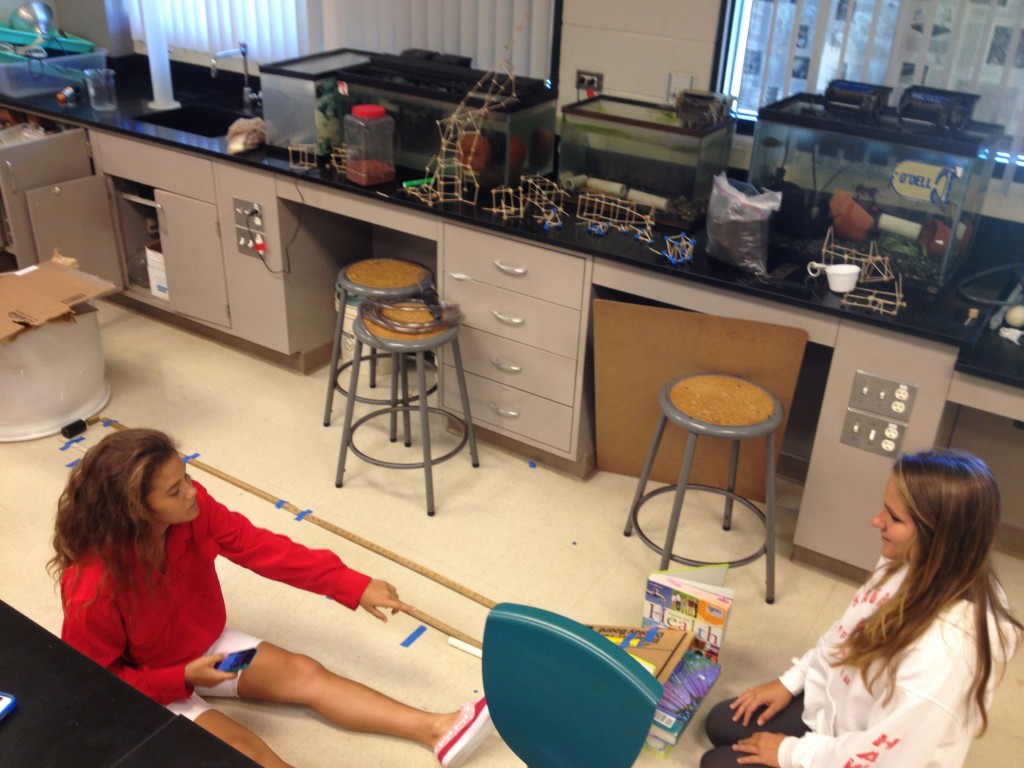
time it takes a cylinder to roll different distances
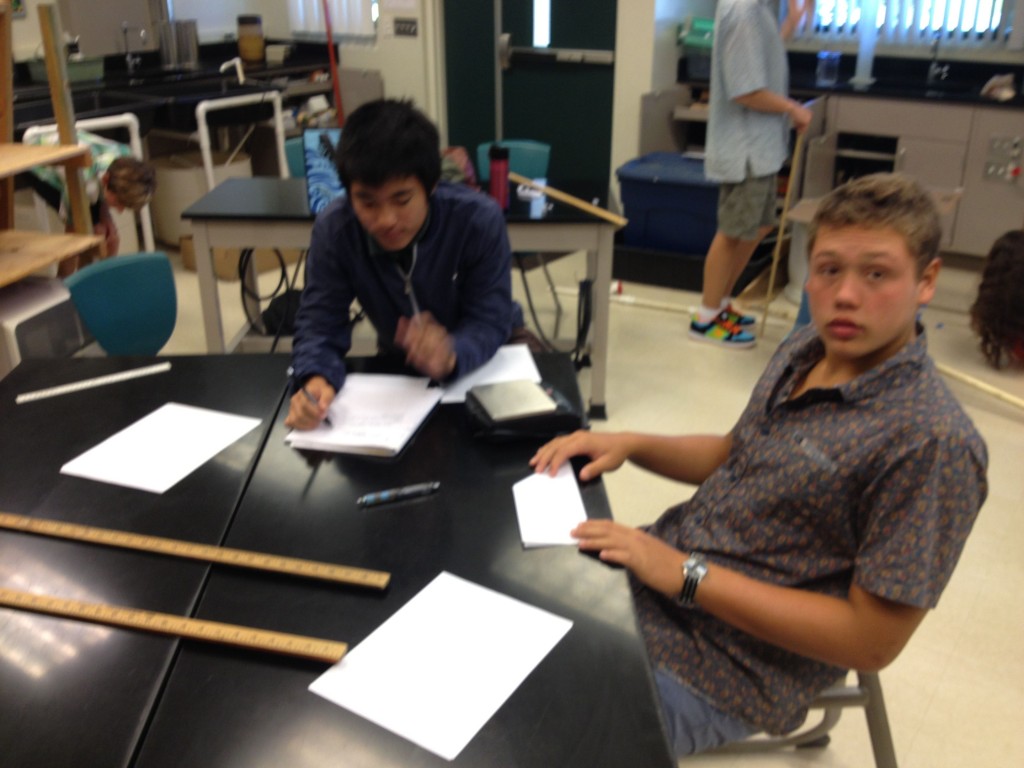
does the mass/size of paper airplane change its travel distance
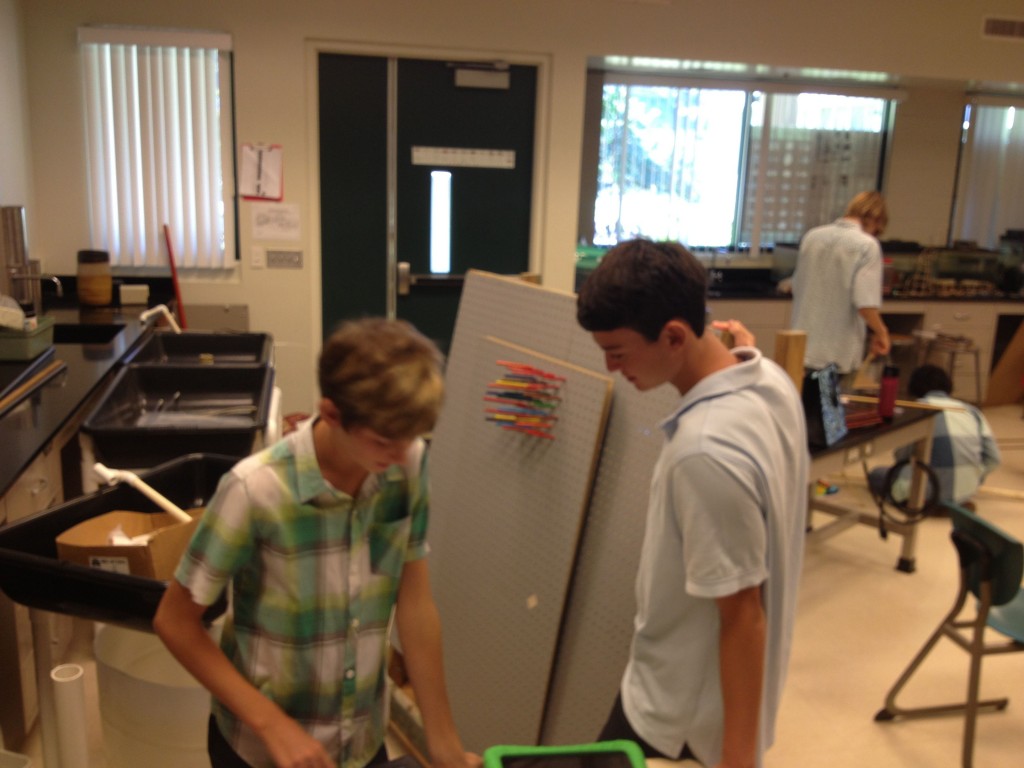
time it takes a ball to roll through different amount of pegs on a surface
comparing height of drop and bounce height for a tennis ball
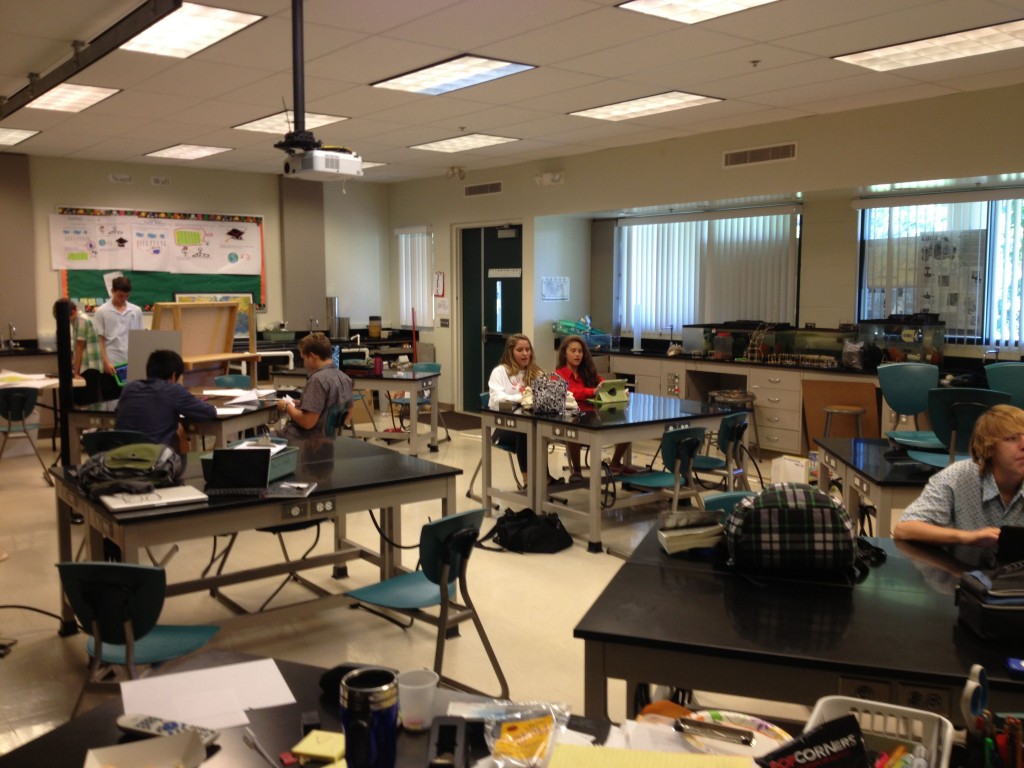
classroom in experimental mode – students acting as scientists and mathematicians
So how did it go? I think the notion of creating real opportunities to practice and implement our mathematical understanding are the places where real mathematicians and the habits of minds of mathematics at her. Certainly, it exposed areas where students were still unsure about something as simple as slope intercept form, or what kind of relationship a scatterplot of data that is not quite linear means. All in all, it lends itself to working and thinking as real mathematicians and scientists, which is the goal of a good STEM education. Here are two examples of submitted work from the activity (in pdf format):
Bounce Height of a Tennis Ball copy
So what’s next? The work that’s coming up next deals with inequalities, and so I’ve been inspired by some work that Alfred Solis did when he was at high Tech high on the connection between art and mathematical form. More to come on this in the next week… A little hint of where were going below:

can we create a mathematical model of this?