On the PSAT, looking at Energy and Art in Math
The past week and a half have seen us focus as a class on three main threads.
The PSAT
Every one of our sophomores takes the PSAT as a means to practice and acclimate that kind of testing environment so that when they take it again as it Junior they are more accustomed to it. In our program, that means an additional layer of testing with multiple choices, since we spend more of our time immersed in deeper thinking about what we know of math and less on practice and rote problem-solving. As a result, the students and I agreed we should spend time just about every day just doing some practice problems which will serve a couple of purposes: give us a better review of the types of math that they are expected to know, cover distinct strategies about doing well on the test, fill in the gaps of areas that they think would help them do better on this first pass at the test. So that end, we’re using resources like the practice tests on majortests.com, the College Board website, and resources that we’ve accumulated to support the math side of the PSAT. We typically start by taking a small number of questions, and then debriefing them either as a class or in groups to better deconstruct the mathematical thinking that underpins those questions.
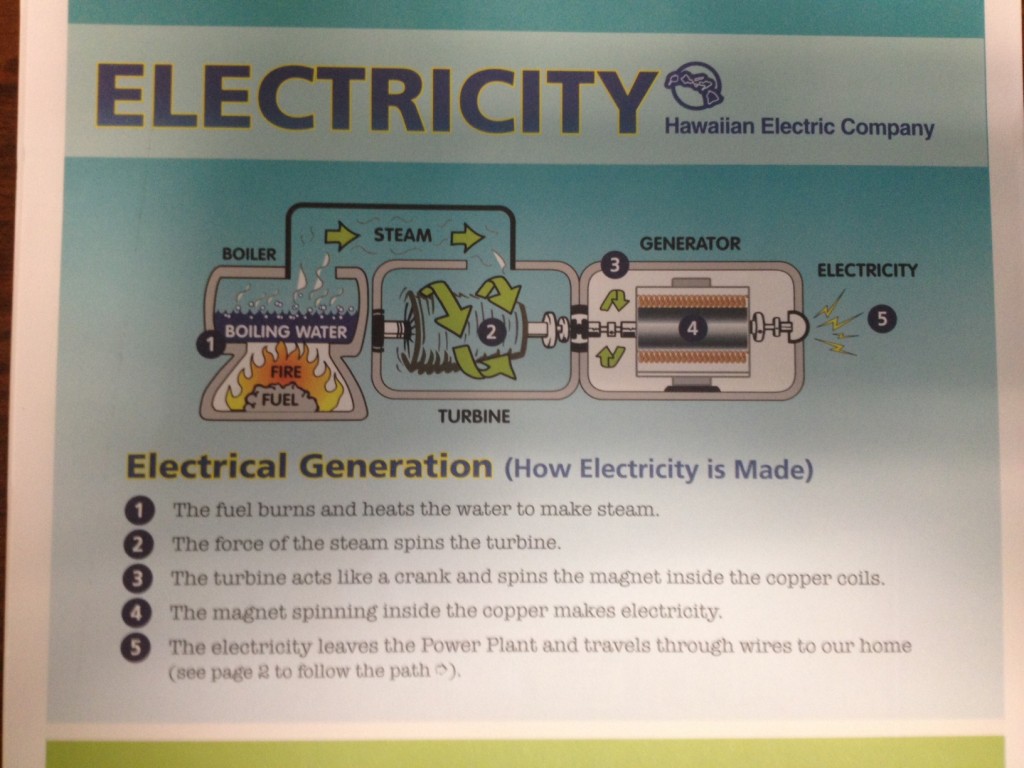
Energy Auditing
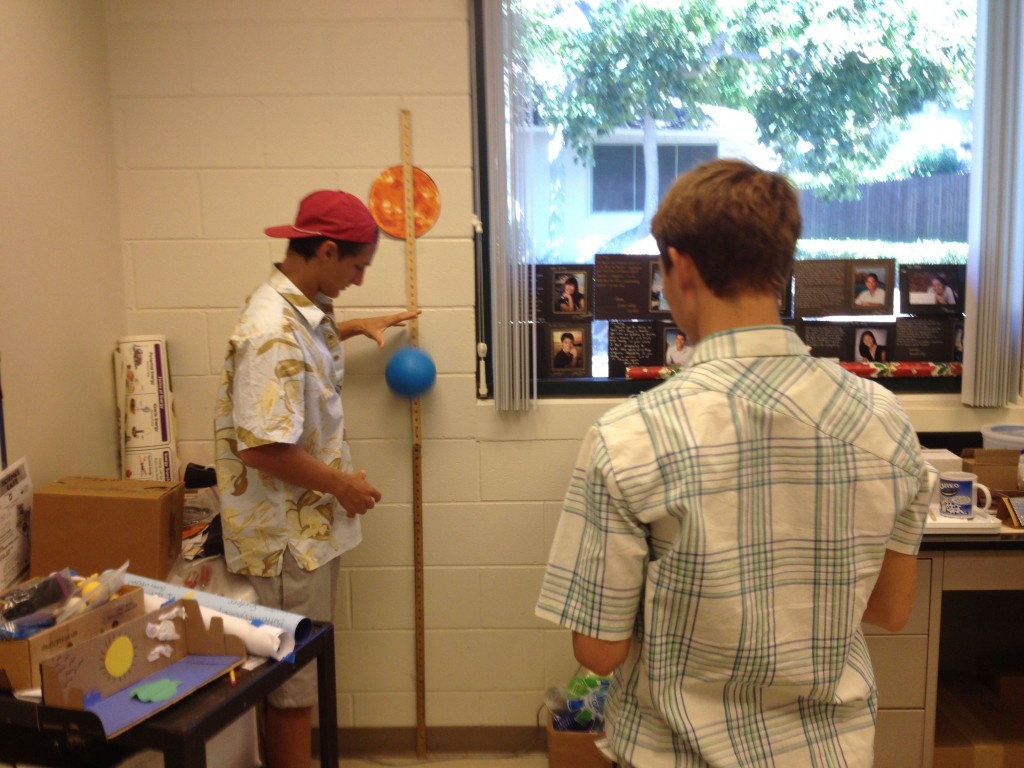
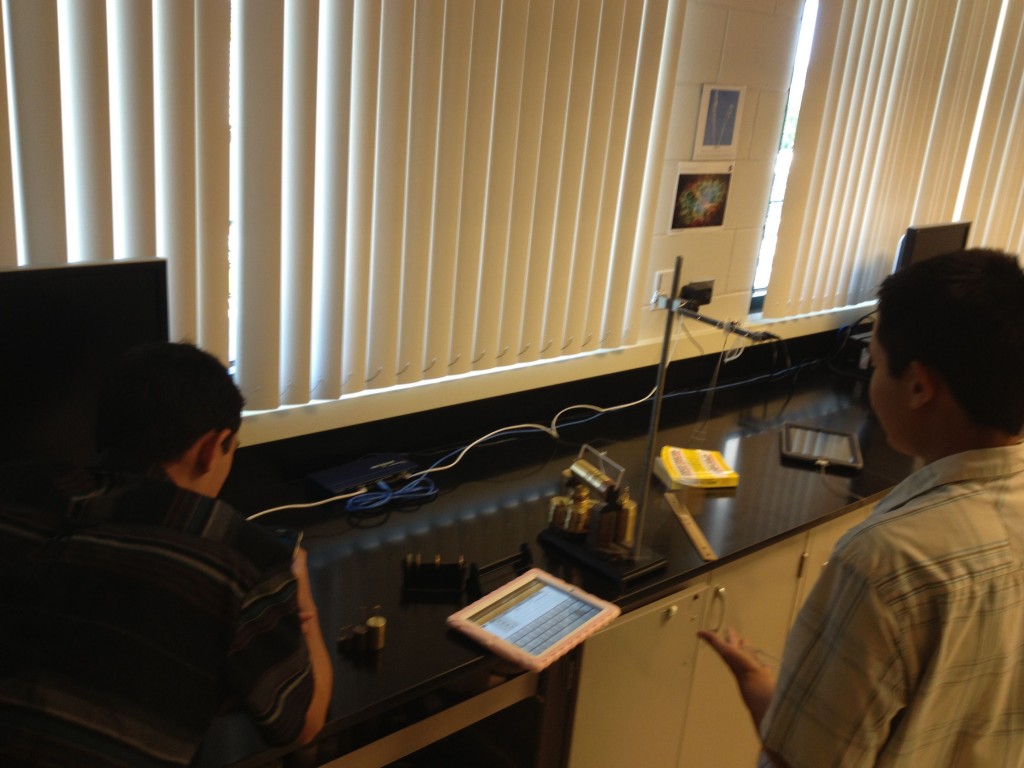
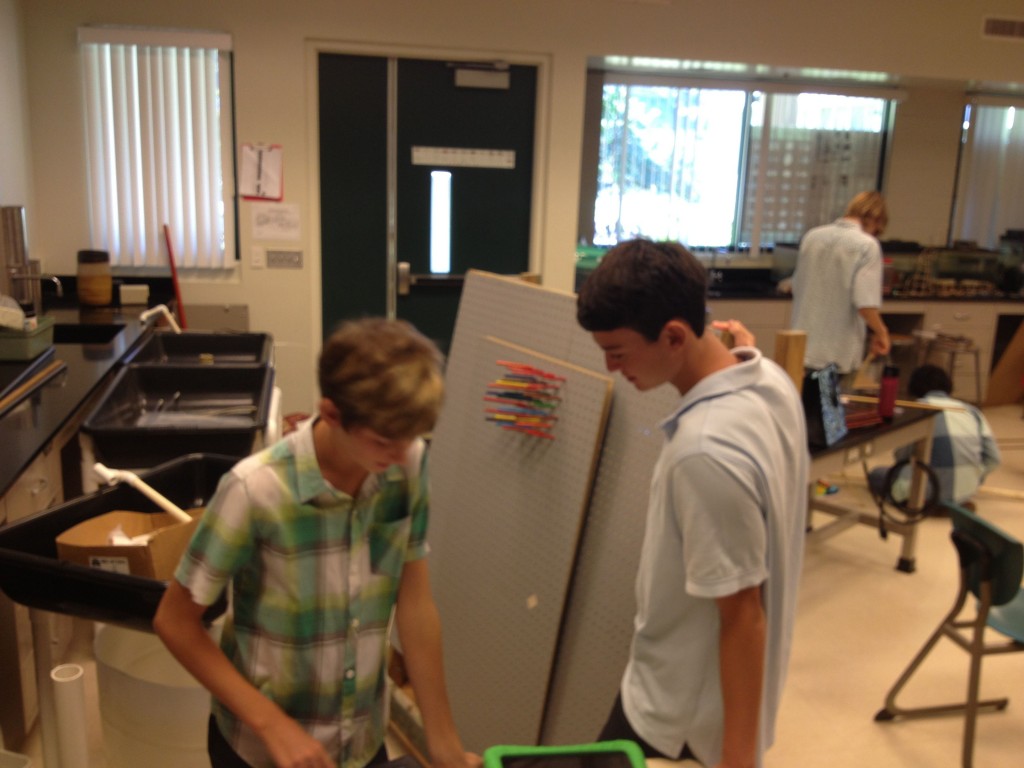
While we are waiting for our full set of equipment to arrive, we have been doing group work tied to understanding how to evaluate a space for electrical energy footprint. Perhaps a example will help in that regard:
Today, their challenge was to take the data from an air conditioner that had been running for 27 minutes, then look at its kilowatt hour usage, and estimate how much it costs to run that device for a month (current Hawaiian Electric cost: $0.34 per kWHr). Once they had that determined, they were then challenged with going to a building, counting how many air-conditioners are in that building, and estimating what the monthly electrical charge is to run the air conditioners in that building. I’ve attached Josh and Kris’s sheet that they gave me as an example, there is also a bonus questions that they were given to determine what the cost should be to run a fan instead – you’ll see that on the bottom:
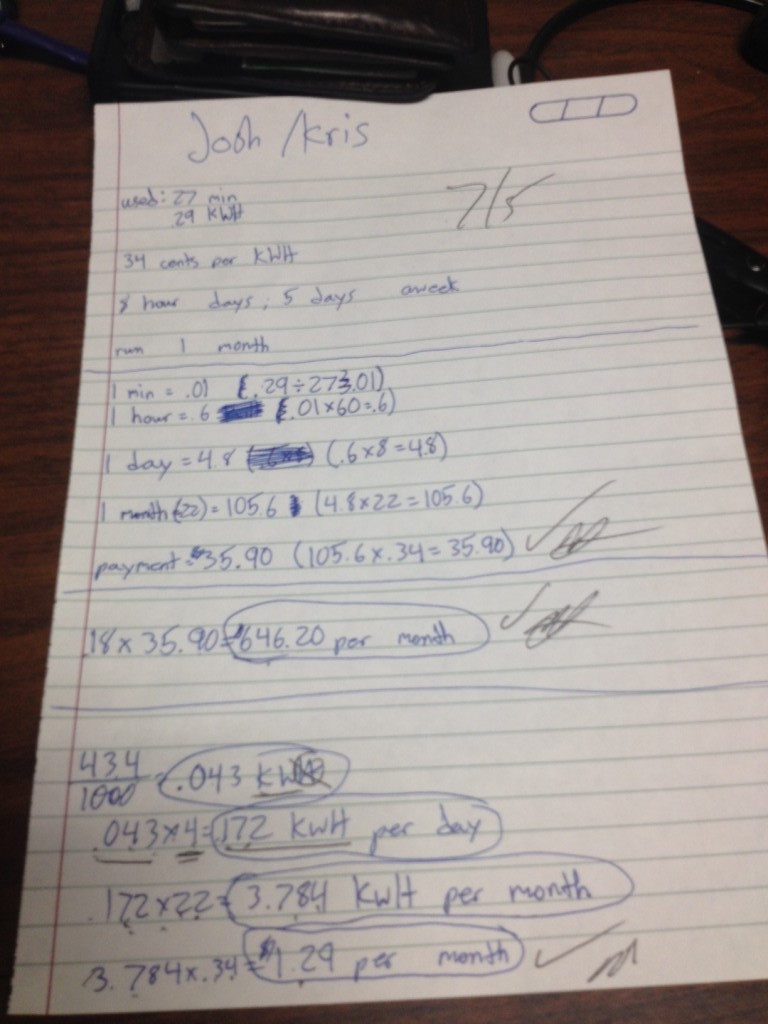
Josh and Matt’s solution for the cost of running the air conditioner in my office
The goal of all this initial work, is to create a more careful eye on their part, not just in being able to calculate correctly the energy usage of the device, but to also think about where these things are and how they might take a position with the client in helping them consider ways to save money and energy.
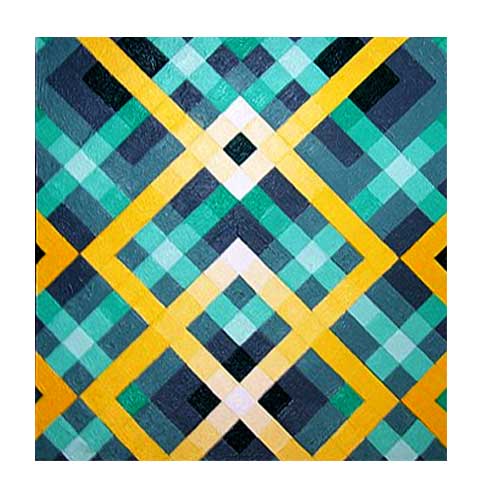
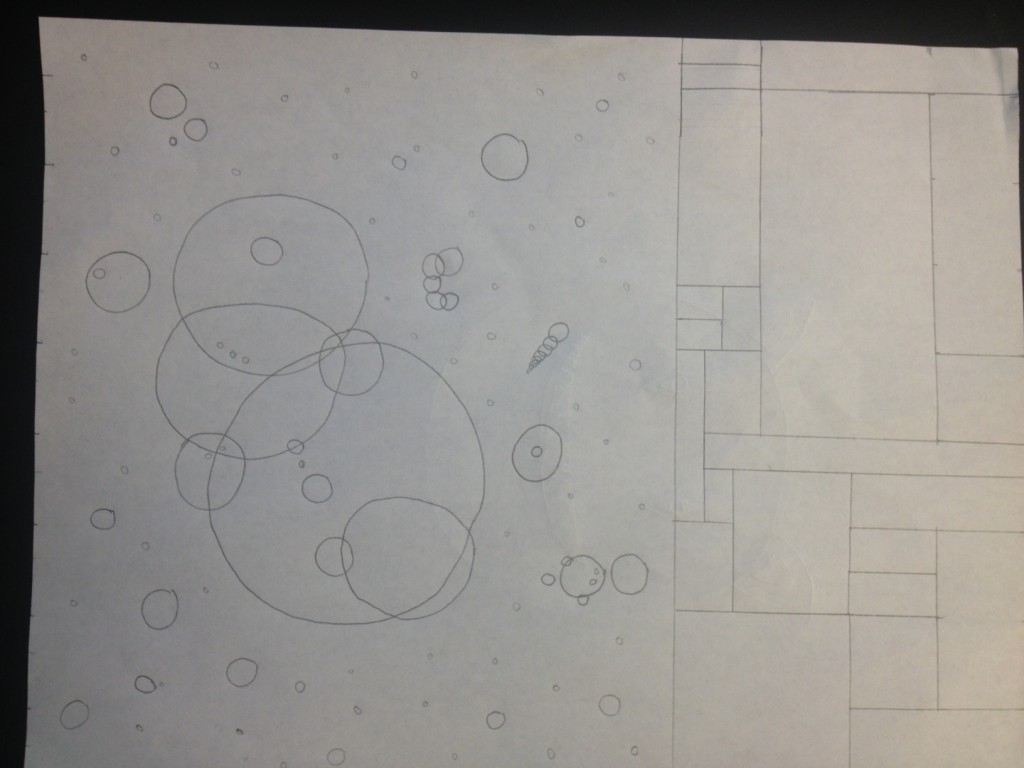
Math in Art
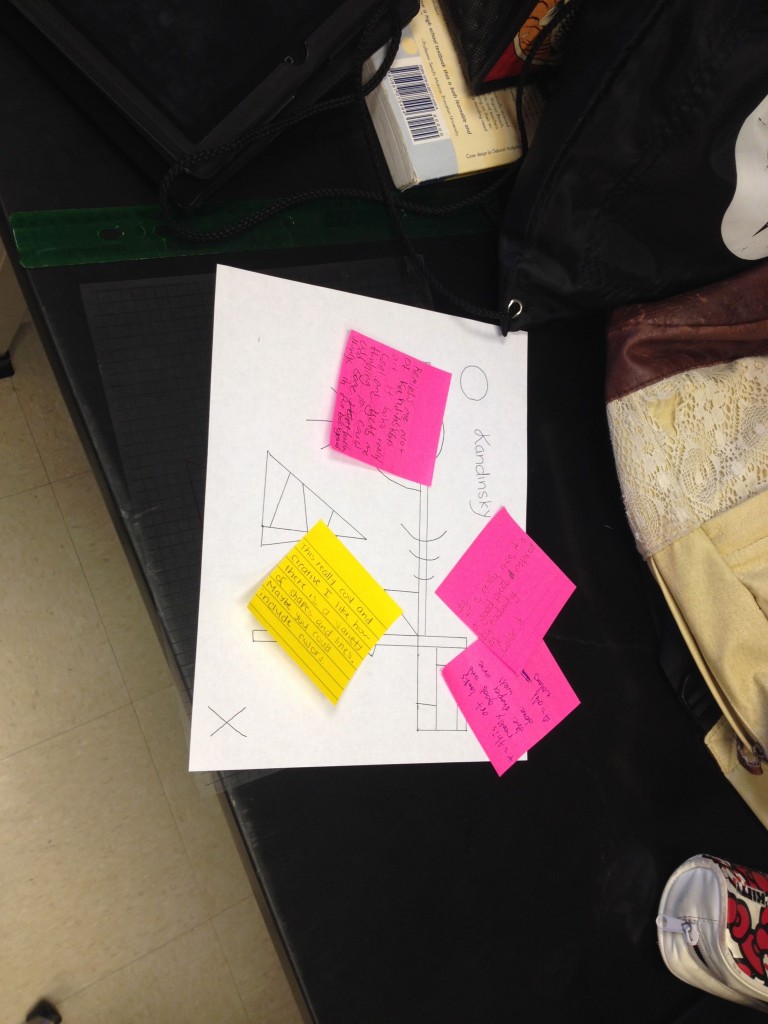
In my last blog post I talked a bit about the project we are undertaking to work with math and art. I just want to share a couple of artifacts that are still in their early stages, but they give a hint of the work that is to come. The pictures below is a shot of both a student hand-drawn art, and the mathematical models using Desmos that give an indication of how they can translate art into clear mathematical function and form.
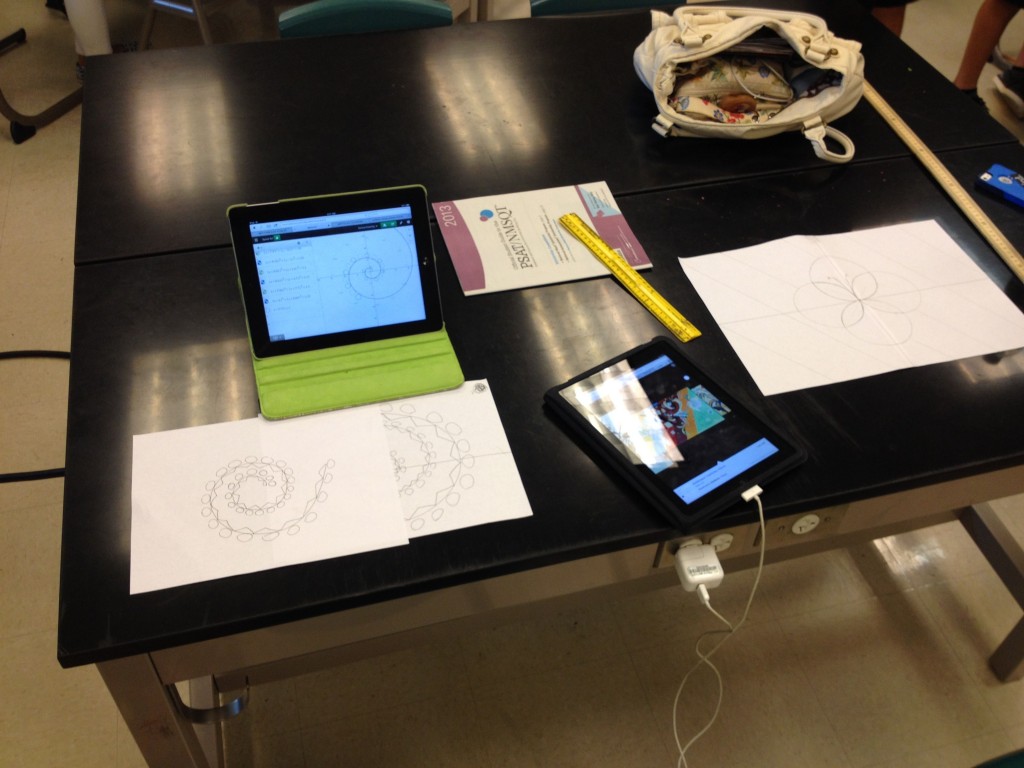
Emma’s art and math model (first pass)
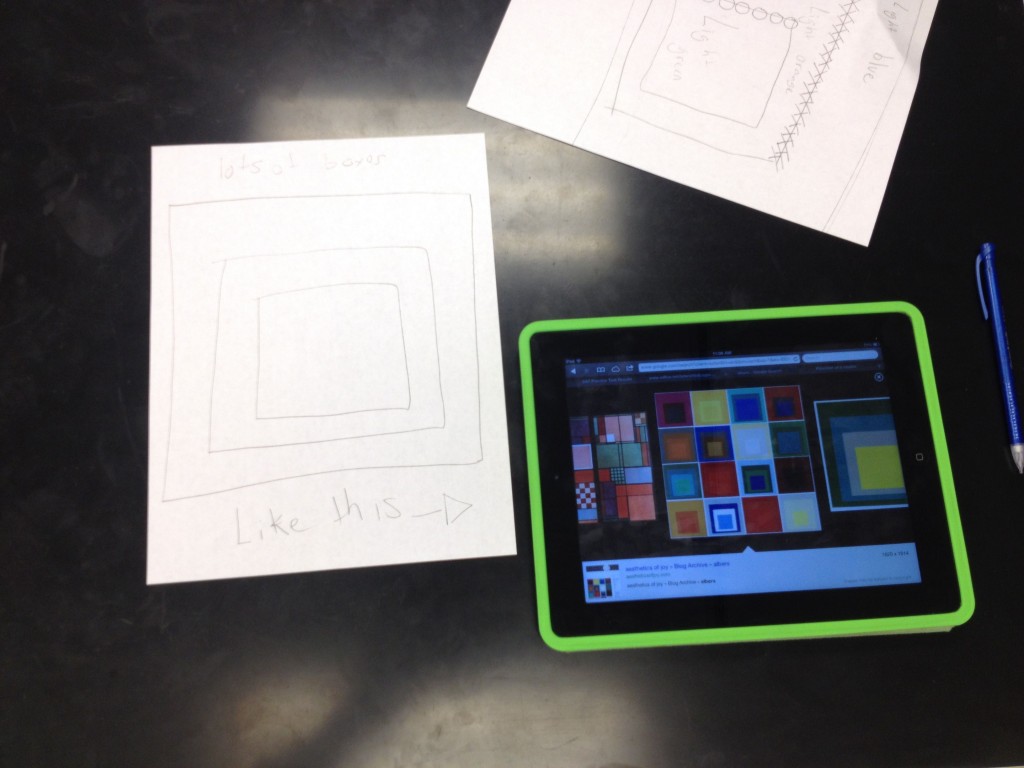
Student work mimicking Albers
***the skill and process of critiquing***
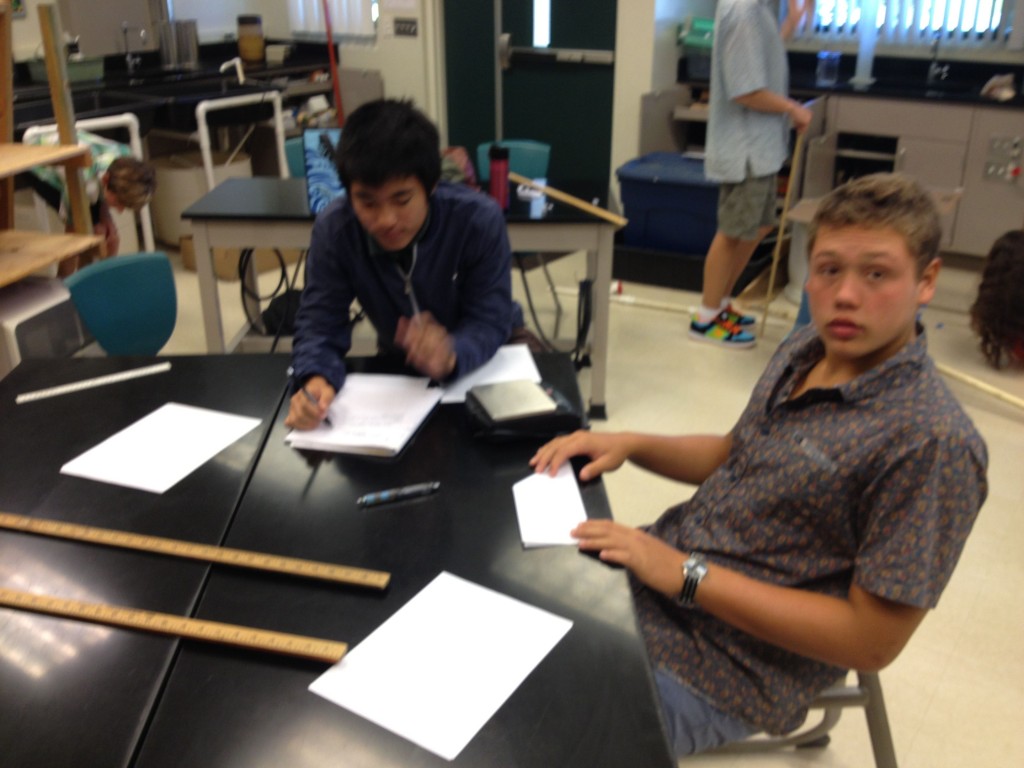
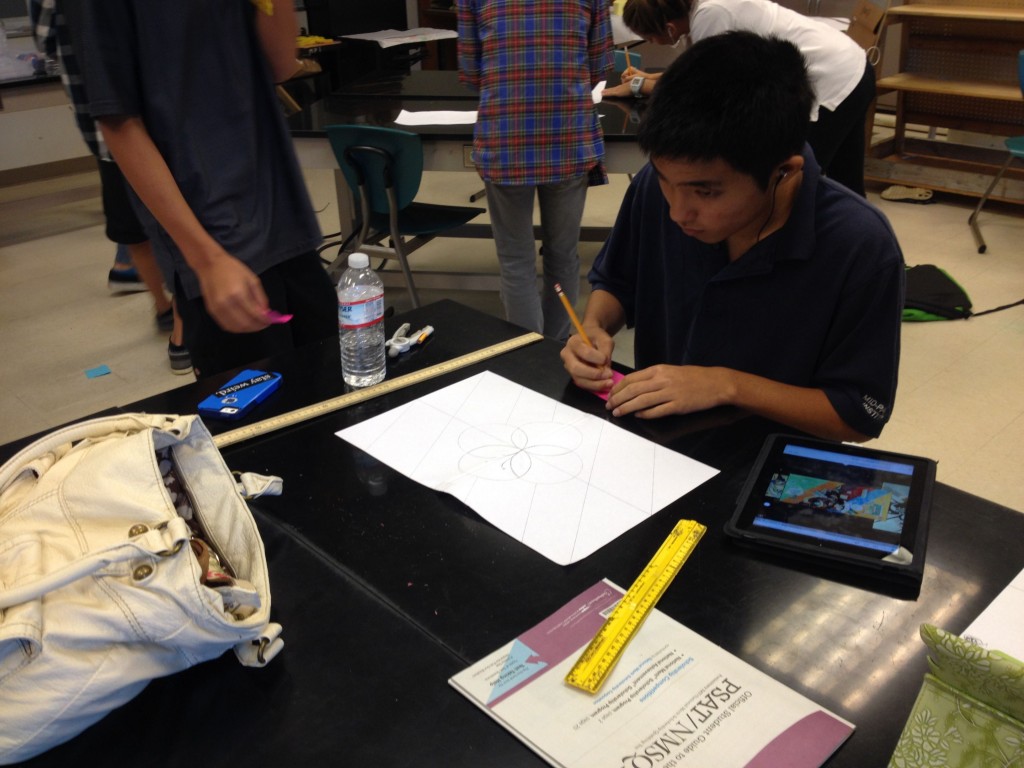
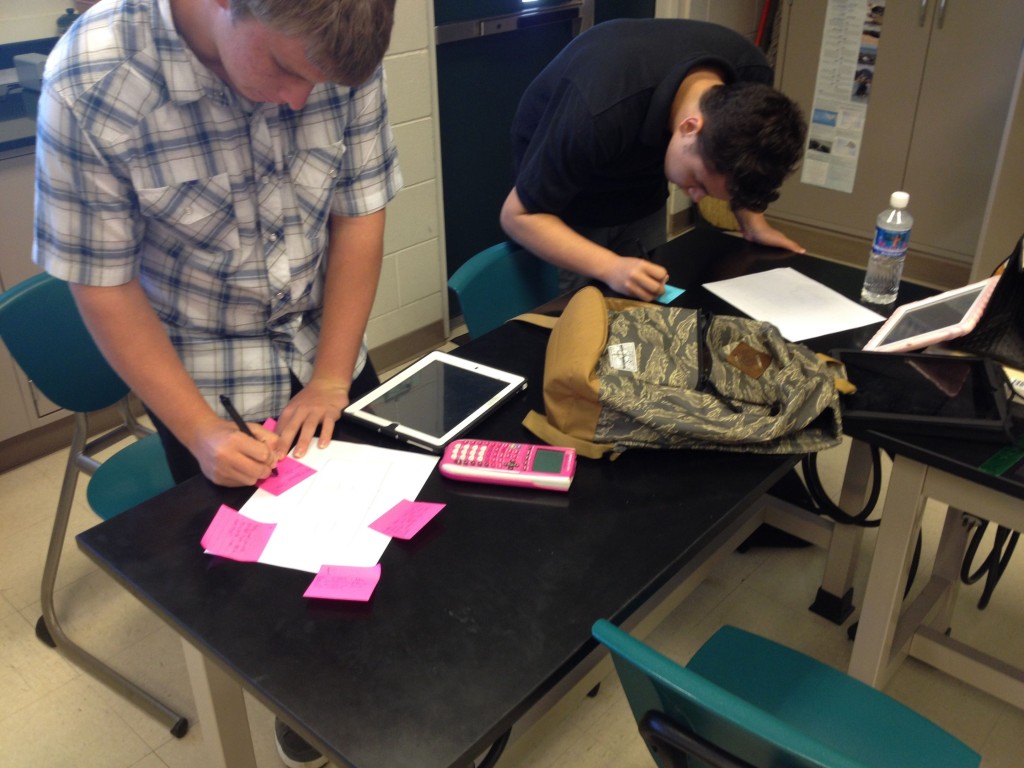
One of the things we believe fundamentally is the importance of critiquing and feedback in improving student work and developing a greater sense of autonomy/agency in student work. Once the students completed their first sketch, they used post it note pads to give each other feedback following our agreements development from Ron Berger:
Be Helpful
Be Kind
Be Specific
Examples of the process :

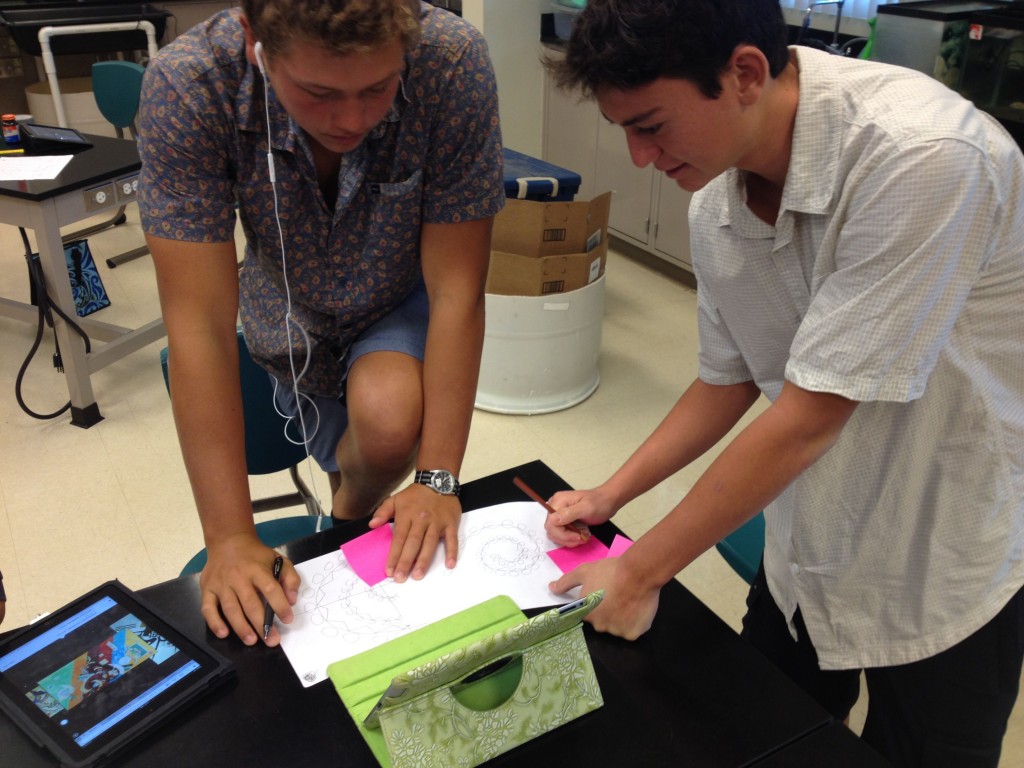
Thinking about helpful specific feedback
Blaine Critiques
Josh leaves some ideas
some critique on a draft
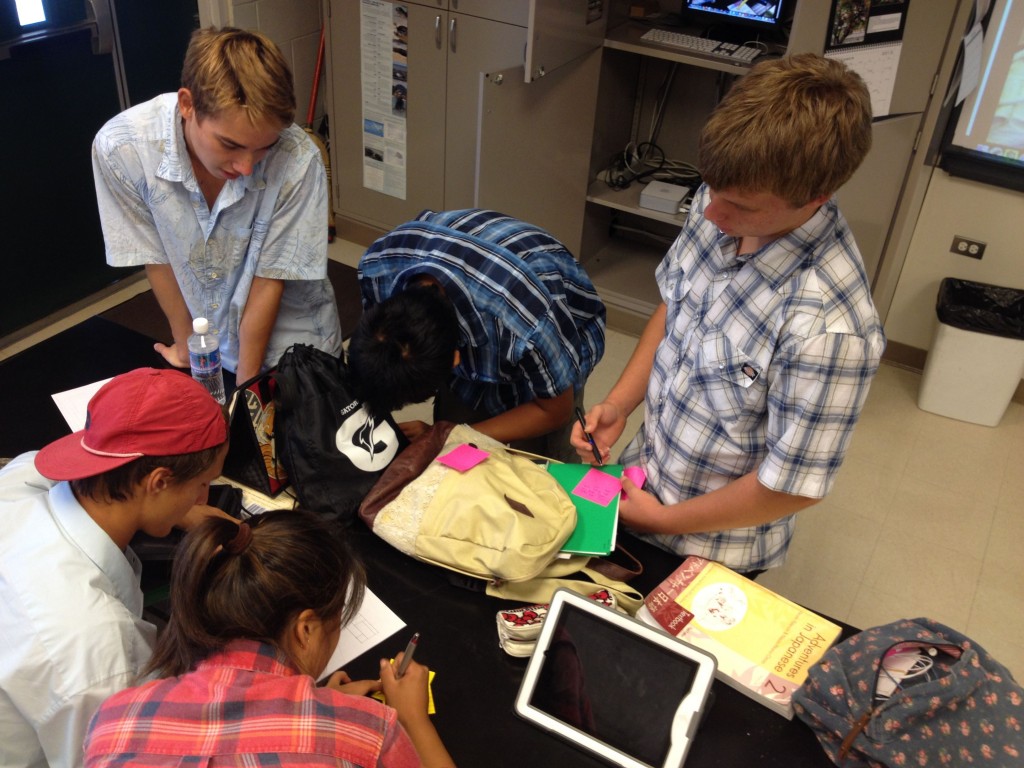
student critiquing
the students did blog posts last week in which they talked about their first round of drawings, the feedback that they received, and their directions. Here are two nice examples from? And? That show where they’re at and give some hint of where they’re going.
More updates to come in another week…